This site uses cookies to improve your experience. To help us insure we adhere to various privacy regulations, please select your country/region of residence. If you do not select a country, we will assume you are from the United States. Select your Cookie Settings or view our Privacy Policy and Terms of Use.
Cookie Settings
Cookies and similar technologies are used on this website for proper function of the website, for tracking performance analytics and for marketing purposes. We and some of our third-party providers may use cookie data for various purposes. Please review the cookie settings below and choose your preference.
Used for the proper function of the website
Used for monitoring website traffic and interactions
Cookie Settings
Cookies and similar technologies are used on this website for proper function of the website, for tracking performance analytics and for marketing purposes. We and some of our third-party providers may use cookie data for various purposes. Please review the cookie settings below and choose your preference.
Strictly Necessary: Used for the proper function of the website
Performance/Analytics: Used for monitoring website traffic and interactions
Introduction If you work with programming languages and are familiar with Python, you must have had a brush with Pandas, a robust yet flexible data manipulation and analysis library. It was founded by Wes McKinney in 2008. appeared first on Analytics Vidhya.
You could dive into gigabytes or even petabytes of data from any industry and derive meaningful interpretations that may catch even the industry insiders by surprise. When the global financial crisis hit the American market in 2008, few.
Introduction Could the American recession of 2008-10 have been avoided if machine learning and artificial intelligence had been used to anticipate the stock market, identify hazards, or uncover fraud? The recent advancements in the banking and finance sector suggest an affirmative response to this question.
Introduction If you’ve been in the data field for quite some time, you’ve probably noticed that some technical skills are becoming more dominant, and the data backs this up. Until the release of NumPy in 2005, Python was considered slow for numeric analysis. But Numpy changed that.
With applications ranging from genomics to image processing, t-SNE helps bridge the gap between intricate data environments and actionable insights. t-SNE was developed by Laurens van der Maaten and Geoffrey Hinton in 2008 to visualize high-dimensional data. What is t-SNE (t-distributed stochastic neighbor embedding)?
Dataanalysis: Enabling automated data collection for better insights and decision-making. Benchmarking in object detection Established in 2008, Pascal VOC became a benchmark for comparing different object detection models. Safety: Improving the accuracy of security systems and enhancing public safety measures.
Photo by Juraj Gabriel on Unsplash Dataanalysis is a powerful tool that helps businesses make informed decisions. In this blog, we’ll be using Python to perform exploratory dataanalysis (EDA) on a Netflix dataset that we’ve found on Kaggle. df['rating'].replace(np.nan, value_counts()[:20].plot(kind="bar",color="Blue")
From 2003 to 2008 he was General. Before that he was part of the management team of Amazon Deutschland GmbH and responsible for the business unit „Consumables“ including health & beauty as well as foods. The post “The market still needs a little more time to get ready for autonomous driving.”-
Fortunately, the first robo-advisors were created in 2008. The robo-advisor handled the actual investment process, using AI dataanalysis and automation to complete trades and react to market changes. Robo-advisors were a unique service that simplified investing for the masses.
The original dataset looks like this: My original CSV file showing the GPI for each country from 2008–2020 What is missing from… Read the full blog for free on Medium. Join thousands of data leaders on the AI newsletter. As a recent example, I was working with a UN dataset called the Global Peace Index (GPI).
After the first 10 testing submissions, I realised that there was a concept drift happening between 2007 and 2008. To me, this probably means, the decision rules for grant applications were somehow changed during 2007 and 2008. What tools I used Software/Tools used for modelling and dataanalysis: Weka 3.7.1
She received the MacArthur Foundation Fellowship in 2004, was awarded the ACM Prize in Computing in 2008, and was recognized as one of TIME Magazine’s 100 most influential people in 2012. Her group designs multiscale models, adaptive sampling approaches, and dataanalysis tools, and uses both data-driven methods and theoretical formulations.
Four reference lines on the x-axis indicate key events in Tableau’s almost two-decade history: The first Tableau Conference in 2008. The first Tableau customer conference was in 2008. Tableau had its IPO at the NYSE with the ticker DATA in 2013. Computers and humans have asymmetric and synergistic data skills.
Knowledge graphs extend the capabilities of graph databases by incorporating mechanisms to infer and derive new knowledge from the existing graph data. This added expressiveness allows for more advanced dataanalysis and extraction of insights across the interconnected data points within the graph.
McKinney, Python for DataAnalysis: Data Wrangling with Pandas, NumPy, and IPython, 2nd ed., 2008 (2nd edition). Packt, ISBN: 978–1787125933, 2017. O’Reilly Media, ISBN: 978–1491957660, 2017. Klein, and E. Natural Language Processing with Python — Analyzing Text with the Natural Language Toolkit. Jurafsky and J.
Each time, the underlying implementation changed a bit while still staying true to the larger phenomenon of “Analyzing Data for Fun and Profit.” ” They weren’t quite sure what this “data” substance was, but they’d convinced themselves that they had tons of it that they could monetize.
Four reference lines on the x-axis indicate key events in Tableau’s almost two-decade history: The first Tableau Conference in 2008. The first Tableau customer conference was in 2008. Tableau had its IPO at the NYSE with the ticker DATA in 2013. Computers and humans have asymmetric and synergistic data skills.
Pandas is an open-source, python-based library used in data manipulation applications requiring high performance. The name is derived from “Panel Data” having multidimensional data. This was developed in 2008 by Wes McKinney and was developed for dataanalysis. Define pandas dataframe.
He left Pittsburgh eight years later to teach at Pennsylvania State University in State College, where in 2001 he became director of its multivariate analysis center. Multivariate statistics are dataanalysis procedures that simultaneously consider more than two variables. He retired in 2008.
For those of us who champion the power of data, the past five years have been an incredible ride thanks to the rise of big data. These are the decoding skills that enable an individual to apply dataanalysis accurately to decision-making.
They are fundamental tools in the realm of scientific programming, allowing users to manage large quantities of data and perform intricate analyses with relative ease. Pandas Overview: Introduced in 2008 by Wes McKinney, Pandas is designed for efficient data manipulation.
Data visualization: Creating dashboards and visual reports to clearly communicate findings to stakeholders. Job title history of data scientist The title “data scientist” gained prominence in 2008 when companies like Facebook and LinkedIn utilized it in corporate job descriptions.
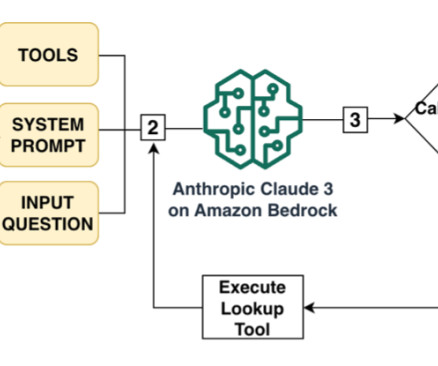
Large language models (LLMs) can help uncover insights from structured data such as a relational database management system (RDBMS) by generating complex SQL queries from natural language questions, making dataanalysis accessible to users of all skill levels and empowering organizations to make data-driven decisions faster than ever before.
We organize all of the trending information in your field so you don't have to. Join 17,000+ users and stay up to date on the latest articles your peers are reading.
You know about us, now we want to get to know you!
Let's personalize your content
Let's get even more personalized
We recognize your account from another site in our network, please click 'Send Email' below to continue with verifying your account and setting a password.


Let's personalize your content