This site uses cookies to improve your experience. To help us insure we adhere to various privacy regulations, please select your country/region of residence. If you do not select a country, we will assume you are from the United States. Select your Cookie Settings or view our Privacy Policy and Terms of Use.
Cookie Settings
Cookies and similar technologies are used on this website for proper function of the website, for tracking performance analytics and for marketing purposes. We and some of our third-party providers may use cookie data for various purposes. Please review the cookie settings below and choose your preference.
Used for the proper function of the website
Used for monitoring website traffic and interactions
Cookie Settings
Cookies and similar technologies are used on this website for proper function of the website, for tracking performance analytics and for marketing purposes. We and some of our third-party providers may use cookie data for various purposes. Please review the cookie settings below and choose your preference.
Strictly Necessary: Used for the proper function of the website
Performance/Analytics: Used for monitoring website traffic and interactions
This article was published as a part of the DataScience Blogathon Introduction Google’s BigQuery is an enterprise-grade cloud-native data warehouse. BigQuery was first launched as a service in 2010, with general availability in November 2011.
An estimated 8,650% growth of the volume of Data to 175 zetabytes from 2010 to 2025 has created an enormous need for Data Engineers to build an organization's big data platform to be fast, efficient and scalable.
This article was published as a part of the DataScience Blogathon. Hive, founded by Facebook and later Apache, is a data storage system created for the purpose of analyzing structured data. Operating under an open-source data platform called Hadoop, Apache Hive is a software application released in 2010 (October).
It is understandable that many computer science majors are considering pursuing careers in this evolving field. Is the Booming Big Data Field Right for You? Everyone has heard about DataScience in 2020. The concept of datascience was first introduced in 2001, but it started gaining popularity in 2010.
Most DataScience enthusiasts know how to write queries and fetch data from SQL but find they may find the concept of indexing to be intimidating. This blog will aim to clear concepts of how this additional tool can help you efficiently access data, especially when there are clear patterns involved.
DataScience. 2782 2122 3 UC San Diego 01/01/2010 Bachelor of Science in Marketing */-Maintain the SQL order simple and efficient as you can, using valid SQL Lite, answer the following questions for the table provided above. DataScience.
A Glimpse into the future : Want to be like a scientist who predicted the rise of machine learning back in 2010? Generative AI and Data Storytelling (Virtual event | 27th September – 2023) A virtual event on generative AI and data storytelling. The speaker is Andrew Madson, a data analytics leader and educator.
Master Python and essential datascience skills with Pickl.AIs free course to enhance your career in datascience. In fact, according to the TIOBE Index, it ranked #1 in March 2025 and has been named “Language of the Year” multiple times, including in 2007, 2010, 2018, 2020, 2021, and 2024.
Let the number of literate people increased by 5000 in 2010-2020 whereas 3500 in 2000-2010. But we also note that the population growth in 2010-2020 is 3 times the other decade. So apparently it seems that there is more work done on the education sector by the government in the last decade.
94-171) Noisy Measurement File (NMF) from United States Census Bureau 2010 Census Production Settings Demographic and Housing Characteristics (DHC) Demonstration Noisy Measurement File from United States Census Bureau 2010 Census Production Settings Redistricting Data (P.L.
After 2010, SaaS-[Software as a Service] became a trend in the market. Domino Data Lab: Domino Data Labs provides a system of record that tracks all datascience activity across an organization and acts as an orchestration layer on the AWS storage foundation. That would have a major impact on IT companies globally.
Analyzing F1 from a fan and datascience perspective could help gain useful insights. Red Bull won the constructors championship from 2010 to 2013. Last Updated on November 18, 2023 by Editorial Team Author(s): Vishnu Regimon Nair Originally published on Towards AI.
Established by Google in 2010, it possesses a vast assortment of geospatial data containing of petabytes of data collected by multiple satellites, such as Sentinel, MODIS, Landsat, and more for analysis. They can also take advantage of extra GCP features for data processing and analysis thanks to this connection.
Traditionally, tabular data has been used for simply organizing and reporting information. However, over the past decade, its usage has evolved significantly due to several key factors: Kaggle Competitions: Kaggle emerged in 2010 [1] and popularized datascience and machine learning competitions using real-world tabular datasets.
His analysis also noted an increasing trend in funding amounts over time, with the average funding per round growing by 15% annually since 2010, reflecting the escalating scale and stakes within the venture capital ecosystem. This trend highlights Stanford’s strong network and reputation within the venture capital ecosystem.
Key Discoveries Participants delved into over a decade’s worth of traffic accident data, uncovering patterns and trends that could inform future safety measures. Reus: 302 accidents FC#3 The most severe accidents 2010–2021: What makes up all these crashes the most or least often? Engage With Other Data Scientists!
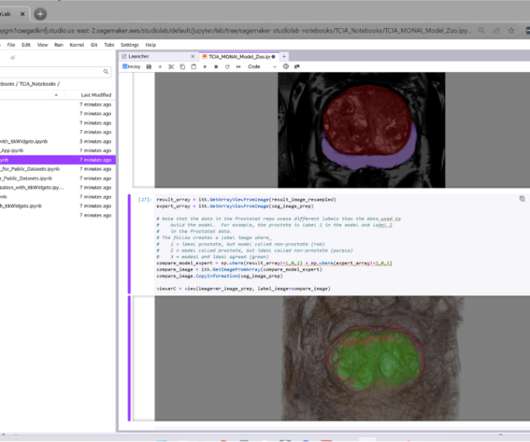
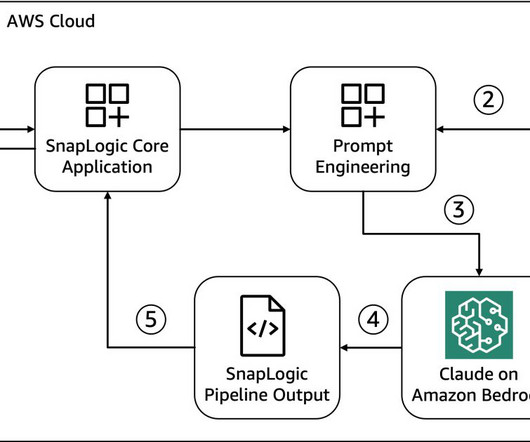
Like the fully featured Amazon SageMaker Studio , Studio Lab allows you to customize your own Conda environment and create CPU- and GPU-scalable JupyterLab version 3 notebooks , with easy access to the latest datascience productivity tools and open-source libraries.
Did you know that big data consumption increased 5,000% between 2010 and 2020 ? Big data technology is changing countless aspects of our lives. A growing number of careers are predicated on the use of data analytics, AI and similar technologies. This should come as no surprise. 3D Printing Designer.
This ongoing process straddles the intersection between evidence-based medicine, datascience, and artificial intelligence (AI). It’s for these reasons that practically everyone involved has a vested interest in SLR automation. This study by Bui et al.
Road to Safety: Traffic Accident Analysis’ is based on over 20,000 traffic accident specifications in Catalunya from 2010–2021. This is a unique opportunity for data people to dive into real-world data and uncover insights that could shape the future of road safety in this region.
The Social Cause: “I Voted” Experiment In 2010 Facebook launched a massive experience wherein it generated an I Voted sticker. As per the claims of Facebook, because of peer pressure, around 340,000 more people cast their votes in the 2010 midterm elections. Frequently Asked Questions How Instagram Uses AI and Big Data?
Launch back in November 2010, which position can display you how nice Santa might be and you may exactly what extremely larger honours come in their handbag. Although not, you wear’t have to be a man to find as many unexpected situations as possible out of his wallet, you do have becoming extremely fortunate.
This historical sales data covers sales information from 2010–02–05 to 2012–11–01. Dataset: [link] Out of the three files present in the dataset, I used the Sales dataset.
If you want to check out the new v3 features from spaCy, check out their blog post here: [link] Large Database of 90M Indian Legal Cases “Development Data Lab has processed and de-identified legal case records for all lower courts in India filed between 2010–2018, using the government’s online case-management portal — E-courts.
Basic Uses of SUMIF in Excel The SUMIF function is available in Excel 365, Excel 2021, Excel 2019, Excel 2016, Excel 2013, Excel 2010, Excel 2007, and older versions. You can also learn Excel and other vital datascience tools by taking datascience courses through Pickl.AI.
For some of the world’s most valuable companies, data forms the core of their business model. The scale of data production and transmission has grown exponentially. However, raw data alone doesn’t equate to actionable insights.
We started with the result of every match (and set scores) for ATP and WTA tour matches from 2010 through 2018. Fans of betting and datascience are excited to see how predictive the 100,000 simulations turn out to be, fed by ATP and WTA matches over nine seasons with Elo scores, and factoring in surface and more.
” There’s as much Keras, TensorFlow, and Torch today as there was Hadoop back in 2010-2012. The data scientist—sorry, “machine learning engineer” or “AI specialist”—job interview now involves one of those toolkits, or one of the higher-level abstractions such as HuggingFace Transformers.
This extensive data provides several weather-related metrics such as daily mean temperature, total rainfall, and total snowfall. The process to calculate the probability of rain involves determining the ratio of the total number of rainy days in June from 2010 to 2022 to the total number of days during the same period.
He joined the USF Department of Computer Science in 1998 and has taught undergraduate and graduate courses including operating systems, computer architecture, programming languages, distributed systems, and introductory programming. He currently is working on Generative AI for data integration.
While this data is not fresh, it is from 2010-2012, we added it to the list because of the holiday sales data that can be used and could still be relevant. Get the dataset here. Shopping Locations in Leeds A dataset containing information about potential shopping spots in Leeds.
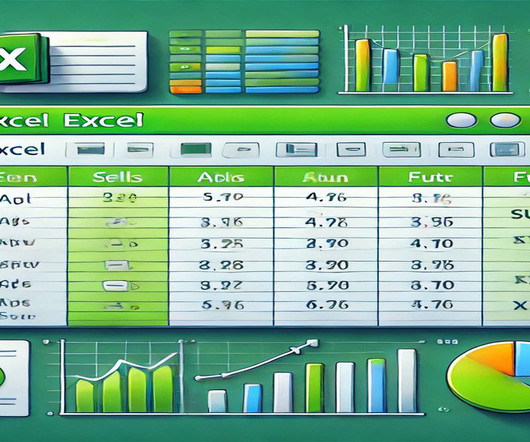
Slicers are visual filtering tools available in Excel that allow users to filter data in tables or PivotTables interactively. Introduced in Excel 2010, slicers provide a user-friendly interface for filtering data based on specific criteria. Slicers are available starting from Excel 2010 onwards for both Windows and Mac versions.
If you want to check out the new v3 features from spaCy, check out their blog post here: [link] Large Database of 90M Indian Legal Cases “Development Data Lab has processed and de-identified legal case records for all lower courts in India filed between 2010–2018, using the government’s online case-management portal — E-courts.
It was initially developed at Facebook to address the challenges of managing massive data volumes for their inbox search feature. Released as an open-source project in 2008 and later becoming a top-level project of the Apache Software Foundation in 2010, Cassandra has gained popularity due to its scalability and high availability features.
The purpose was just to elicit your curiosity and give you an idea of what can be achieved with some robotics and datascience background. 2010, doi: 10.1109/TBME.2010.2060723. If you have time, will, and a Myo armband at hand, feel free to extend this project! References [1] I. Handel, J. -O. Nilsson and J. 2657–2666, Nov.
Founded in 2010, DeepMind was acquired by Google in 2014 and has since become one of the most respected AI research companies in the world. The success of ChatGPT has cemented OpenAI’s position as a leader in the Generative AI space and has sparked a renewed interest in the potential of this technology.
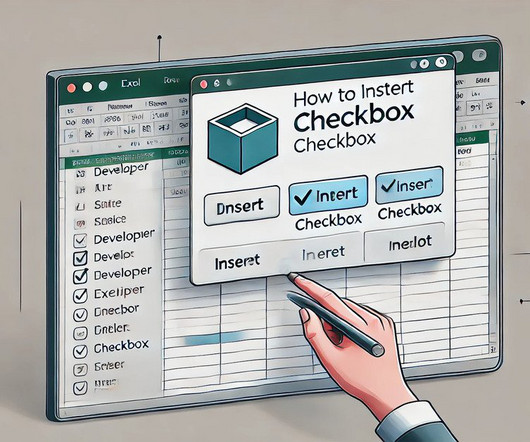
Access Excel Options : For Excel 2010 or later, click on the “File” tab in the top-left corner. Follow these steps to enable this tab and prepare your Excel environment for adding checkboxes. Open Excel : Start by opening Microsoft Excel on your computer. Select “Options” from the menu to open the Excel Options window.
Winning teams included individuals with expertise in computer science, engineering, biomedical informatics, neuroscience, psychology, datascience, sociology, and various clinical specialties. Dr. Reid also teaches DataScience at the University of California at Berkeley. She earned her Ph.D.
In many datascience projects, including this one, we more often care about the model's performance on unseen data, that is, data the model hasn't seen/wasn't trained on. This is also called "hold-out data" or "test data" or "validation data" depending on how it's used and who's saying it.)
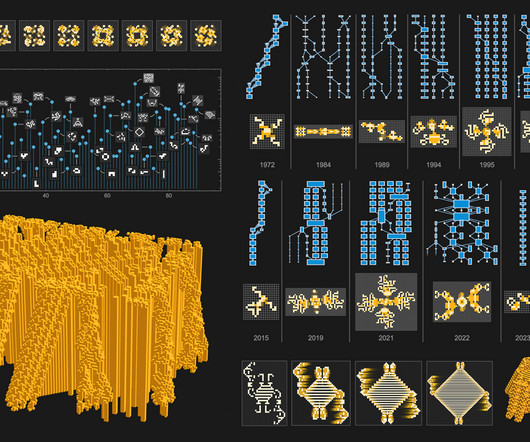
Bennett (2006), Robert Wainwright (2010), Dave Greene (2011), Steve Bourne (2018), Tanha Kate (2018), Simon Norton (2018), Adam Goucher (2019), Keith Patarroyo (2021), Steph Macurdy (2021), Mark McAndrew (2022), Richard Assar (2024) and Nigel Martin (2025).
Of course, we can’t miss Artificial Intelligence, Deep Learning, Machine Learning, DataScience, HPC, Blockchain, and IoT, which totally relies on data and definitely need a database to store them and process them later. Data is recorded as graphs rather than tables in this database management system software.
Understanding the DE-SynPUF dataset The DE-SynPUF dataset is a synthetic database released by the Centers for Medicare and Medicaid Services (CMS), designed to simulate Medicare claims data from 2008–2010. For simplicity, we use only data from Sample 1. During his spare time, he likes to play tennis and golf. He received a Ph.D.
We organize all of the trending information in your field so you don't have to. Join 17,000+ users and stay up to date on the latest articles your peers are reading.
You know about us, now we want to get to know you!
Let's personalize your content
Let's get even more personalized
We recognize your account from another site in our network, please click 'Send Email' below to continue with verifying your account and setting a password.


Let's personalize your content