Remove 2014 Remove Data Models Remove Data Visualization
article thumbnail

How to Optimize Power BI and Snowflake for Advanced Analytics

phData

Two of the platforms that we see emerging as a popular combination of data warehousing and business intelligence are the Snowflake Data Cloud and Power BI. Debuting in 2015, Power BI has undergone meaningful updates that have made it a leader not just in data visualization, but in the business intelligence space as well.

article thumbnail

How to choose a graph database: we compare 6 favorites

Cambridge Intelligence

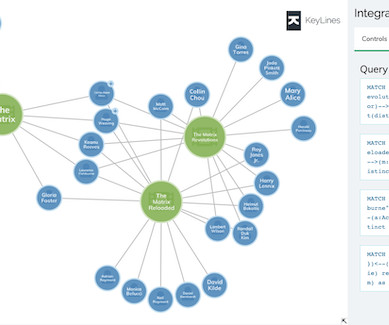
That’s why our data visualization SDKs are database agnostic: so you’re free to choose the right stack for your application. Multi-model databases combine graphs with two other NoSQL data models – document and key-value stores. Transactional, analytical, or both…?

professionals

Sign Up for our Newsletter

This site is protected by reCAPTCHA and the Google Privacy Policy and Terms of Service apply.

article thumbnail

Analyzing the history of Tableau innovation

Tableau

The visual encoding allowed domain experts to immediately see that blended data was inappropriate, which is why Blending was useful to people who did not understand joins. . The Data Tab was added in v8.2 June 2014) to give people who understand joins a better experience than a dialog. Relationships in Tableau 2020.2 (May

Tableau 145
article thumbnail

Analyzing the history of Tableau innovation

Tableau

The visual encoding allowed domain experts to immediately see that blended data was inappropriate, which is why Blending was useful to people who did not understand joins. . The Data Tab was added in v8.2 June 2014) to give people who understand joins a better experience than a dialog. Relationships in Tableau 2020.2 (May

Tableau 98