

Analyzing the history of Tableau innovation
Tableau
DECEMBER 1, 2021
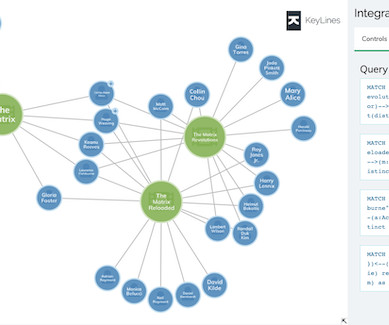
Query allowed customers from a broad range of industries to connect to clean useful data found in SQL and Cube databases. The prototype could connect to multiple data sources at the same time—a precursor to Tableau’s investments in data federation. The Data Tab was added in v8.2


Let's personalize your content