This site uses cookies to improve your experience. To help us insure we adhere to various privacy regulations, please select your country/region of residence. If you do not select a country, we will assume you are from the United States. Select your Cookie Settings or view our Privacy Policy and Terms of Use.
Cookie Settings
Cookies and similar technologies are used on this website for proper function of the website, for tracking performance analytics and for marketing purposes. We and some of our third-party providers may use cookie data for various purposes. Please review the cookie settings below and choose your preference.
Used for the proper function of the website
Used for monitoring website traffic and interactions
Cookie Settings
Cookies and similar technologies are used on this website for proper function of the website, for tracking performance analytics and for marketing purposes. We and some of our third-party providers may use cookie data for various purposes. Please review the cookie settings below and choose your preference.
Strictly Necessary: Used for the proper function of the website
Performance/Analytics: Used for monitoring website traffic and interactions
Empowering Data Scientists and Engineers with Lightning-Fast DataAnalysis and Transformation Capabilities Photo by Hans-Jurgen Mager on Unsplash ?Goal Abstract Polars is a fast-growing open-source data frame library that is rapidly becoming the preferred choice for data scientists and data engineers in Python.
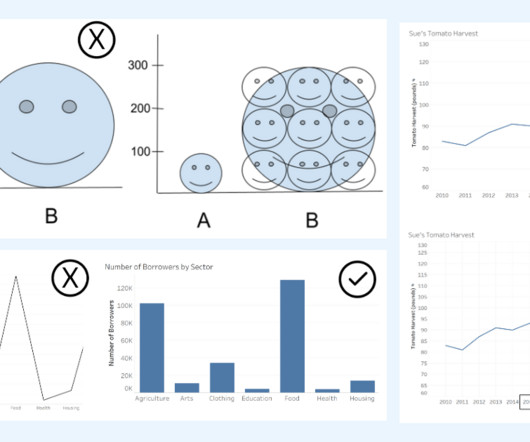
Alberto Cairo, datavisualization expert and author of How Charts Lie Whether you are reading a social post, news article or business report, it’s important to know and evaluate the source of the data and charts that you view. Two line graphs showing the same data with different intervals on the axis. Know the Source.
DataAnalysis is the process of collecting, cleaning, transforming, and modeling data to extract useful information and insights. In today’s data-driven world, dataanalysis has become an essential skill for organizations across industries to make informed decisions and improve business outcomes.
Image by Author Tools The following tools were used to assist the dataanalysis process: Tableau: Used to create the visualizations. JupyterHub: Used to wrangle, clean, and prepare the dataset for visualization. Read individual CSV files and combine them on race ID, constructor ID, driver ID, circuit ID, and status ID.
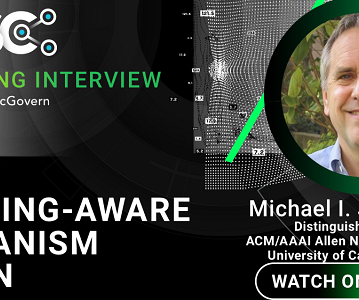
He received the Ulf Grenander Prize from the American Mathematical Society in 2021, the IEEE John von Neumann Medal in 2020, the IJCAI Research Excellence Award in 2016, the David E. His research interests bridge the computational, statistical, cognitive, biological, and social sciences.
Fantasy Football is a popular pastime for a large amount of the world, we gathered data around the past 6 seasons of player performance data to see what our community of data scientists could create. This report took the data set provided in the challenge, as well as external data feeds and alternative sources.
Data Scientist LinkedIn Profile Example Marla Smith, Senior Data Scientist at ABC Company Summary: Experienced data scientist with a strong background in statistical analysis, machine learning, and datavisualization.
Presumably due to this fact, Andrew Ng, in his presentation in NeurIPS 2016, gave a rough and abstract predictions of how transfer learning in machine learning would make commercial success like white lines in the figure below. And sometimes ad hoc analysis with simple datavisualization will help your decision makings.
The Art of Forecasting in the Retail Industry Part I : Exploratory DataAnalysis & Time Series Analysis In this article, I will conduct exploratory dataanalysis and time series analysis using a dataset consisting of product sales in different categories from a store in the US between 2015 and 2018.
Adam Selipsky becoming CEO in 2016. Tableau had its IPO at the NYSE with the ticker DATA in 2013. Chris and Christian stepped out of operational roles when Adam Selipsky became CEO in 2016. VizQL: A domain-specific language for visual, self-service analysis. IPO in 2013. The Salesforce purchase in 2019.
Adam Selipsky becoming CEO in 2016. Tableau had its IPO at the NYSE with the ticker DATA in 2013. Chris and Christian stepped out of operational roles when Adam Selipsky became CEO in 2016. VizQL: A domain-specific language for visual, self-service analysis. IPO in 2013. The Salesforce purchase in 2019.
We organize all of the trending information in your field so you don't have to. Join 17,000+ users and stay up to date on the latest articles your peers are reading.
You know about us, now we want to get to know you!
Let's personalize your content
Let's get even more personalized
We recognize your account from another site in our network, please click 'Send Email' below to continue with verifying your account and setting a password.


Let's personalize your content