This site uses cookies to improve your experience. To help us insure we adhere to various privacy regulations, please select your country/region of residence. If you do not select a country, we will assume you are from the United States. Select your Cookie Settings or view our Privacy Policy and Terms of Use.
Cookie Settings
Cookies and similar technologies are used on this website for proper function of the website, for tracking performance analytics and for marketing purposes. We and some of our third-party providers may use cookie data for various purposes. Please review the cookie settings below and choose your preference.
Used for the proper function of the website
Used for monitoring website traffic and interactions
Cookie Settings
Cookies and similar technologies are used on this website for proper function of the website, for tracking performance analytics and for marketing purposes. We and some of our third-party providers may use cookie data for various purposes. Please review the cookie settings below and choose your preference.
Strictly Necessary: Used for the proper function of the website
Performance/Analytics: Used for monitoring website traffic and interactions
The challenge required a detailed analysis of Google Trends data, integration of additional data sources, and the application of advanced ML methods to predict market behaviors. Participants demonstrated outstanding abilities in utilizing ML and data analysis to probe and predict movements within the cryptocurrency market.
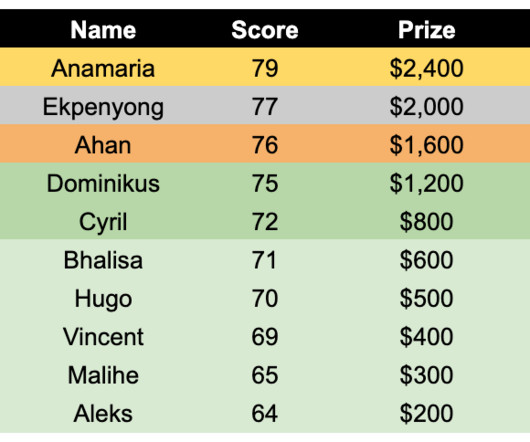
AI / ML offers tools to give a competitive edge in predictive analytics, business intelligence, and performance metrics. This data challenge took NFL player performance data and fantasy points from the last 6 seasons to calculate forecasted points to be scored in the 2024 NFL season that began Sept.
I finished to EDA & Time Series Analysis, I will build some ML or DL model. In addition, I aim to reveal valuable patterns and trends in the data set by examining the statistical properties of numerical variables. Finally, the Residuals graph shows the residuals. The residuals show the deviation levels around the data.
We organize all of the trending information in your field so you don't have to. Join 17,000+ users and stay up to date on the latest articles your peers are reading.
You know about us, now we want to get to know you!
Let's personalize your content
Let's get even more personalized
We recognize your account from another site in our network, please click 'Send Email' below to continue with verifying your account and setting a password.


Let's personalize your content