This site uses cookies to improve your experience. To help us insure we adhere to various privacy regulations, please select your country/region of residence. If you do not select a country, we will assume you are from the United States. Select your Cookie Settings or view our Privacy Policy and Terms of Use.
Cookie Settings
Cookies and similar technologies are used on this website for proper function of the website, for tracking performance analytics and for marketing purposes. We and some of our third-party providers may use cookie data for various purposes. Please review the cookie settings below and choose your preference.
Used for the proper function of the website
Used for monitoring website traffic and interactions
Cookie Settings
Cookies and similar technologies are used on this website for proper function of the website, for tracking performance analytics and for marketing purposes. We and some of our third-party providers may use cookie data for various purposes. Please review the cookie settings below and choose your preference.
Strictly Necessary: Used for the proper function of the website
Performance/Analytics: Used for monitoring website traffic and interactions
Technical Fellow, Tableau. Tableau has been helping people and organizations to see and understand data for almost two decades, bringing exciting innovations to the landscape of business intelligence with every product release. I am proud to announce that my History of Tableau Innovation viz is now published to Tableau Public.
It’s one of our guiding principles at Tableau and why we support students and instructors around the globe through Tableau Academic Programs. When I first joined the Tableau Academic Programs Team in 2017, many professors would refer me to their Computer Science or Statistics department. We have provided more than 1.7
Social Media and Blog Specialist, Tableau. Tableau Ambassadors teach and share while fostering a positive and supportive space within the data community. Tableau Ambassadors serve one-year terms in one of seven branches: Forums, User Groups, Student, DataDev, Public, Social, and CRM Analytics. Bronwen Boyd. Britt Staniar.
Britt Staniar Senior Community Program Manager, Recognition Programs Brittni McCafferty Community Global Program Manager – User Groups Sarah Molina March 3, 2023 - 9:04pm March 4, 2023 Tableau Ambassadors teach and share while fostering a positive and supportive space within the community. What do Tableau User Group Ambassadors do?
Think your customers will pay more for data visualizations in your application? Five years ago they may have. But today, dashboards and visualizations have become table stakes. Discover which features will differentiate your application and maximize the ROI of your embedded analytics. Brought to you by Logi Analytics.
It’s one of our guiding principles at Tableau and why we support students and instructors around the globe through Tableau Academic Programs. When I first joined the Tableau Academic Programs Team in 2017, many professors would refer me to their Computer Science or Statistics department. We have provided more than 1.7
Technical Fellow, Tableau. Tableau has been helping people and organizations to see and understand data for almost two decades, bringing exciting innovations to the landscape of business intelligence with every product release. I am proud to announce that my History of Tableau Innovation viz is now published to Tableau Public.
Britt Staniar Senior Community Program Manager, Recognition Programs Brittni McCafferty Community Global Program Manager – User Groups Sarah Molina March 3, 2023 - 9:04pm March 4, 2023 Tableau Ambassadors teach and share while fostering a positive and supportive space within the community. What do Tableau User Group Ambassadors do?
Gartner has again recognized Tableau as a Leader—for our ninth consecutive year. . I first want to thank you, the Tableau Community, for your continued support and your commitment to data, to Tableau, and to each other. With your input, we released more than 200 new capabilities across the Tableau platform in 2020.
Chief Product Officer, Tableau. Tableau has been named a Leader in the Gartner Magic Quadrant for Analytics & Business Intelligence Platforms for the 10th consecutive year. We believe a decade as a Leader is an incredible milestone—and it wouldn’t be possible without you, our amazing Tableau Community. . Tanna Solberg.
Chief Product Officer, Tableau. Tableau has been named a Leader in the Gartner Magic Quadrant for Analytics & Business Intelligence Platforms for the 10th consecutive year. We believe a decade as a Leader is an incredible milestone—and it wouldn’t be possible without you, our amazing Tableau Community. . Tanna Solberg.
Social Media and Blog Specialist, Tableau. Tableau Ambassadors teach and share while fostering a positive and supportive space within the data community. Tableau Ambassadors serve one-year terms in one of seven branches: Forums, User Groups, Student, DataDev, Public, Social, and CRM Analytics. Bronwen Boyd. Britt Staniar.
Social Media and Blog Specialist, Tableau. Tableau Ambassadors teach and share while fostering a positive and supportive space within the data community. Tableau Ambassadors serve one-year terms in one of seven branches: Forums, User Groups, Student, DataDev, Public, Social, and CRM Analytics. Bronwen Boyd. Britt Staniar.
The evolution of data analytics The term “augmented intelligence” was introduced by Gartner in 2017, highlighting the shift towards systems that support human decision-making rather than replacing it.
Gartner has again recognized Tableau as a Leader—for our ninth consecutive year. . I first want to thank you, the Tableau Community, for your continued support and your commitment to data, to Tableau, and to each other. With your input, we released more than 200 new capabilities across the Tableau platform in 2020.
Senior Product Marketing Manager, Tableau. To jumpstart analysis in minutes—regardless of skill level—visit the Tableau Exchange to get Dashboard Extensions, Connectors, and Accelerators that help you quickly create use cases and visualizations for a variety of industries, departments, and applications. . Jessica Murguia.
While I created the visuals mainly in Jupyter Notebook using Matplotlib and Seaborn for direct analysis and its flexibility, in this part of the blog I also use images generated by Tableau for a polished and reader-friendly presentation. Therefore, below is the monthly average price of HDB flats from January 2017 to August 2023.
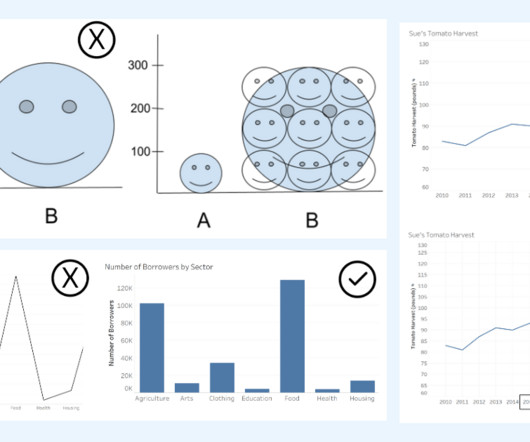
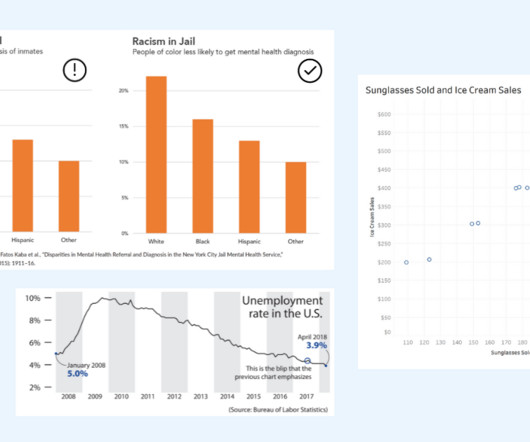
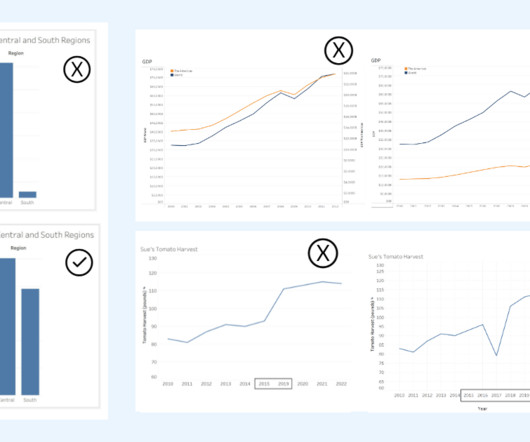
Alyssa Jenson November 14, 2023 - 6:59pm Sue Kraemer Senior Data Skills Curriculum Strategy Manager, Tableau Charts are all around us. Andy Cotgreave , Senior Data Evangelist, Tableau at Salesforce To aid your thoughtful review of charts, we created a handy 4 part checklist with an easy to remember acronym, SCAM.
Senior Product Marketing Manager, Tableau. To jumpstart analysis in minutes—regardless of skill level—visit the Tableau Exchange to get Dashboard Extensions, Connectors, and Accelerators that help you quickly create use cases and visualizations for a variety of industries, departments, and applications. . Jessica Murguia.
Image by Author Tools The following tools were used to assist the data analysis process: Tableau: Used to create the visualizations. Hamilton has been dominating for the past seven years, and he was the world champion in 2015, 2017, 2018, 2019, and 2020. Remove erroneous values. Create a new CSV file based on the newly cleaned dataset.
Kelly and her team at Headwaters Economics used Tableau to create two powerful dashboards to visualize the inequitable realities of wildfire risk and help decision makers find solutions. Initial prototypes in 2017 and 2018 focused on Santa Fe, New Mexico, and Austin, Texas , respectively. “We Visualizing the risks .
Director, Community Programs & Engagement at Tableau. We are just weeks away from Tableau Conference and the ultimate visualization showdown —Iron Viz 2021—where three fierce contestants will take the virtual stage for an intense lightning round of live viz-tastic storytelling. . Andrew Grinaker. Ateken Abla. October 11, 2021 - 5:30pm.
Director, Community Programs & Engagement at Tableau. We are just weeks away from Tableau Conference and the ultimate visualization showdown —Iron Viz 2021—where three fierce contestants will take the virtual stage for an intense lightning round of live viz-tastic storytelling. . Andrew Grinaker. Ateken Abla. October 11, 2021 - 5:30pm.
Ateken Abla November 14, 2023 - 6:59pm Sue Kraemer Senior Data Skills Curriculum Strategy Manager, Tableau Charts exist everywhere. Andy Cotgreave , Senior Data Evangelist, Tableau at Salesforce To aid your thoughtful review of charts, we created a handy 4 part checklist with an easy to remember acronym, SCAM.
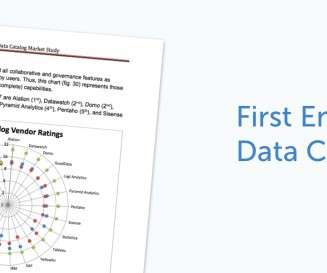
What is unique about this report is that it is based on thousands of end-users who were surveyed as part of Dresner Advisory’s Wisdom of Crowds 2017. We’ve teamed up with Tableau and MicroStrategy to deliver integrated products to support this approach. 2017 Wisdom of Crowds® Data Catalog Market Study.
Kelly and her team at Headwaters Economics used Tableau to create two powerful dashboards to visualize the inequitable realities of wildfire risk and help decision makers find solutions. Initial prototypes in 2017 and 2018 focused on Santa Fe, New Mexico, and Austin, Texas , respectively. “We Visualizing the risks.
It was down to Qlik, Microsoft, Microstrategy, and Tableau to represent and discover the complexities of the College Scorecard Data from the U.S. In perhaps a preview of things to come next year, we decided to test how a Data Catalog might work with Tableau on the same data. Tableau has taken off for thousands of his employees.
Ateken Abla November 14, 2023 - 6:59pm Sue Kraemer Senior Data Skills Curriculum Strategy Manager, Tableau Charts are all around us. Andy Cotgreave , Senior Data Evangelist, Tableau at Salesforce To aid your thoughtful review of charts, we created a handy 4 part checklist with an easy to remember acronym, SCAM.
As a platform, we also offer connectors to more than 100 popular data sources , including integrations with Microsoft Excel, Slack, and Tableau, which simplify and accelerate workflows for anyone working with data across the modern data stack. As CMO, David will oversee our global marketing strategy.
The next stops on the MLDC World Tour include Data Transparency in Washington, Gartner Symposium/ITxpo in Orlando, Teradata Analytics Universe in Las Vegas, Tableau in New Orleans, Big Data LDN in London, TDWI in Orlando and Forrester Data Strategy & Insights in Orlando, again. Data Catalogs Are the New Black.
Be it the stellar customer and analyst sessions at Tableau Conference in New Orleans or Forrester Data Strategy & Insights 2018 in Orlando, or the professional grade, bullet proof Alation Arena of robots at Strata Data Conference in New York or the Teradata Analytics Universe in Las Vegas, our rockstar avatar didn’t fail to impress.
As a platform, we also offer connectors to more than 100 popular data sources , including integrations with Microsoft Excel, Slack, and Tableau, which simplify and accelerate workflows for anyone working with data across the modern data stack. As CMO, David will oversee our global marketing strategy.
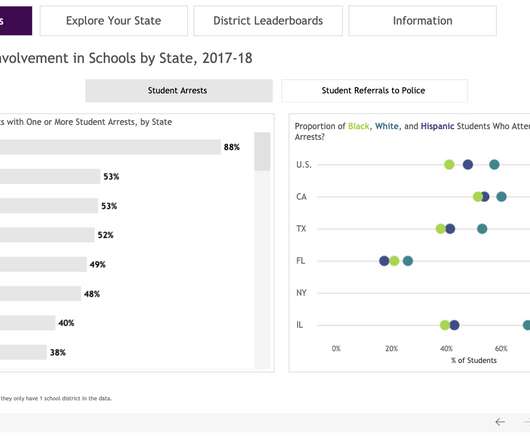
Co-lead of Tableau Foundation’s Racial Justice Data Initiative. Advisor, Tableau Racial Equity Data Hub. Data shows significant racial disparities in referrals and arrests: From 2017 to 2018, LA reported that of the 425 students arrested after being referred to law enforcement, 91 were Black, and 23 were white. Channing Nesbitt.
Zwischenzeitlich wurde die Business Intelligence mit Tools wie Qlik Sense, Tableau, Power BI und Looker (und vielen anderen) weiter im Markt ausgebaut, die recht neue Disziplin Process Mining (vor allem durch das deutsche Unicorn Celonis) etabliert und Data Science schloss als Hype nahtlos an Big Data etwa ab 2017 an, wurde dann ungefähr im Jahr 2021 (..)
Co-lead of Tableau Foundation’s Racial Justice Data Initiative. Advisor, Tableau Racial Equity Data Hub. Data shows significant racial disparities in referrals and arrests: From 2017 to 2018, LA reported that of the 425 students arrested after being referred to law enforcement, 91 were Black, and 23 were white. Channing Nesbitt.
Forecasting water output from cloud collection nets (with Dar Si Hmad, Tableau Foundation): Data from local sensors and weather stations can provide an advanced view into how much fresh water will be collected by fog nets for landlocked communities in Southwest Morocco.
We organize all of the trending information in your field so you don't have to. Join 17,000+ users and stay up to date on the latest articles your peers are reading.
You know about us, now we want to get to know you!
Let's personalize your content
Let's get even more personalized
We recognize your account from another site in our network, please click 'Send Email' below to continue with verifying your account and setting a password.


Let's personalize your content