This site uses cookies to improve your experience. To help us insure we adhere to various privacy regulations, please select your country/region of residence. If you do not select a country, we will assume you are from the United States. Select your Cookie Settings or view our Privacy Policy and Terms of Use.
Cookie Settings
Cookies and similar technologies are used on this website for proper function of the website, for tracking performance analytics and for marketing purposes. We and some of our third-party providers may use cookie data for various purposes. Please review the cookie settings below and choose your preference.
Used for the proper function of the website
Used for monitoring website traffic and interactions
Cookie Settings
Cookies and similar technologies are used on this website for proper function of the website, for tracking performance analytics and for marketing purposes. We and some of our third-party providers may use cookie data for various purposes. Please review the cookie settings below and choose your preference.
Strictly Necessary: Used for the proper function of the website
Performance/Analytics: Used for monitoring website traffic and interactions
Cleanlab is an open-source software library that helps make this process more efficient (via novel algorithms that automatically detect certain issues in data) and systematic (with better coverage to detect different types of issues). How does cleanlab work?
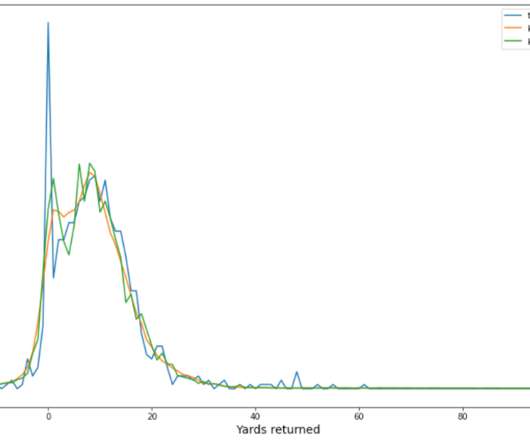
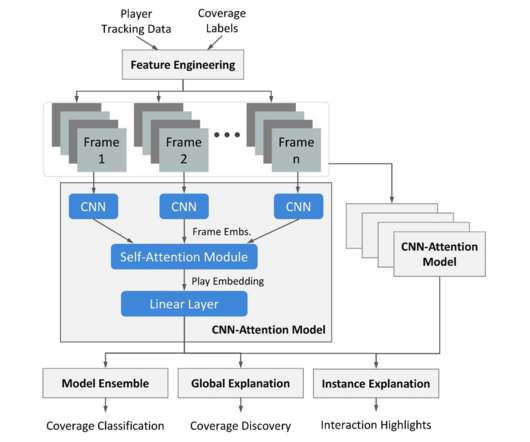
The player tracking data contains the player’s position, direction, acceleration, and more (in x,y coordinates). There are around 3,000 and 4,000 plays from four NFL seasons (2018–2021) for punt and kickoff plays, respectively. The data distribution for punt and kickoff are different.
The quality of your training data in Machine Learning (ML) can make or break your entire project. This article explores real-world cases where poor-quality data led to model failures, and what we can learn from these experiences. By the end, you’ll see why investing in quality data is not just a good idea, but a necessity.
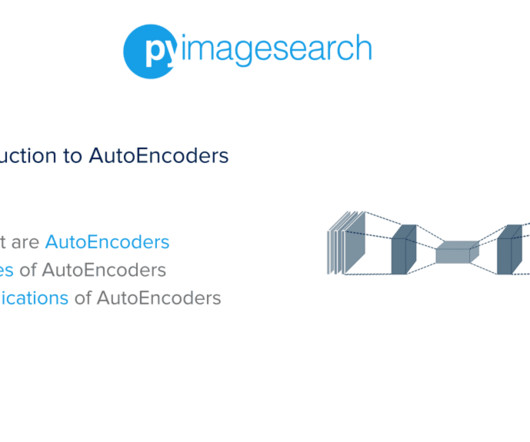
By using our mathematical notation, the entire training process of the autoencoder can be written as follows: Figure 2 demonstrates the basic architecture of an autoencoder: Figure 2: Architecture of Autoencoder (inspired by Hubens, “Deep Inside: Autoencoders,” Towards Data Science , 2018 ).
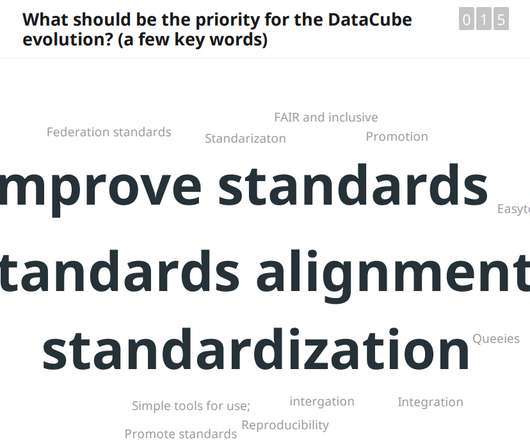
Video Presentation of the B3 Project’s Data Cube. Presenters and participants had the opportunity to hear about and evaluate the pros and cons of different back end technologies and data formats for different uses such as web-mapping, data visualization, and the sharing of meta-data. 2018, July). Giuliani, G.,
Quantitative evaluation We utilize 2018–2020 season data for model training and validation, and 2021 season data for model evaluation. We design an algorithm that automatically identifies the ambiguity between these two classes as the overlapping region of the clusters. Each season consists of around 17,000 plays.
He holds a PhD in Electrical Engineering from the University of Michigan, where his research was focused on efficient algorithms for large-scale machine learning problems, with a particular emphasis on computer vision applications. Brian Moore is co-founder and CTO of Voxel51, where he leads technical strategy and vision.
We organize all of the trending information in your field so you don't have to. Join 17,000+ users and stay up to date on the latest articles your peers are reading.
You know about us, now we want to get to know you!
Let's personalize your content
Let's get even more personalized
We recognize your account from another site in our network, please click 'Send Email' below to continue with verifying your account and setting a password.


Let's personalize your content