This site uses cookies to improve your experience. To help us insure we adhere to various privacy regulations, please select your country/region of residence. If you do not select a country, we will assume you are from the United States. Select your Cookie Settings or view our Privacy Policy and Terms of Use.
Cookie Settings
Cookies and similar technologies are used on this website for proper function of the website, for tracking performance analytics and for marketing purposes. We and some of our third-party providers may use cookie data for various purposes. Please review the cookie settings below and choose your preference.
Used for the proper function of the website
Used for monitoring website traffic and interactions
Cookie Settings
Cookies and similar technologies are used on this website for proper function of the website, for tracking performance analytics and for marketing purposes. We and some of our third-party providers may use cookie data for various purposes. Please review the cookie settings below and choose your preference.
Strictly Necessary: Used for the proper function of the website
Performance/Analytics: Used for monitoring website traffic and interactions
It’s one of our guiding principles at Tableau and why we support students and instructors around the globe through Tableau Academic Programs. Our mission is to lower the barrier of entry to learning analytics and build data literacy skills in future generations. . Data skills are also interdisciplinary.
Technical Fellow, Tableau. Innovation is necessary to use data effectively in the pursuit of a better world, particularly because data continues to increase in size and richness. I am proud to announce that my History of Tableau Innovation viz is now published to Tableau Public. Jock Mackinlay. Bronwen Boyd.
National Solutions Engineer, Tableau. Similar to the advancements in telescope technology, datavisualizations 10 years ago were no where near the art they’ve become today. Vizzes advance as the industry learns more about accessibility and human cognition, and as improved data literacy pushes the world to be more data driven.
National Solutions Engineer, Tableau . Similar to the advancements in telescope technology, datavisualizations 10 years ago were no where near the art they’ve become today. Vizzes advance as the industry learns more about accessibility and human cognition, and as improved data literacy pushes the world to be more data driven.
See the curated collection below showcasing some incredible American football vizzes from the Tableau Community. Clicking into each viz, you’ll land on Tableau Public , Tableau’s free online platform used to explore, create and publicly share datavisualizations.
See the curated collection below showcasing some incredible American football vizzes from the Tableau Community. Clicking into each viz, you’ll land on Tableau Public , Tableau’s free online platform used to explore, create and publicly share datavisualizations.
It’s one of our guiding principles at Tableau and why we support students and instructors around the globe through Tableau Academic Programs. Our mission is to lower the barrier of entry to learning analytics and build data literacy skills in future generations. Data skills are also interdisciplinary.
Technical Fellow, Tableau. Innovation is necessary to use data effectively in the pursuit of a better world, particularly because data continues to increase in size and richness. I am proud to announce that my History of Tableau Innovation viz is now published to Tableau Public. Jock Mackinlay. Bronwen Boyd.
Gartner has again recognized Tableau as a Leader—for our ninth consecutive year. . I first want to thank you, the Tableau Community, for your continued support and your commitment to data, to Tableau, and to each other. With your input, we released more than 200 new capabilities across the Tableau platform in 2020.
Director, Community Programs & Engagement at Tableau. July 5, 2018 - 9:55pm. While there is no single way to accelerate your data skills, all roads lead through the Tableau Community. Dzifa Amexo , Tableau Public Ambassador. Here are five ways you can get started in the Tableau Community today.
Director, Community Programs & Engagement at Tableau. July 5, 2018 - 9:55pm. While there is no single way to accelerate your data skills, all roads lead through the Tableau Community. Dzifa Amexo , Tableau Public Ambassador. Here are five ways you can get started in the Tableau Community today.
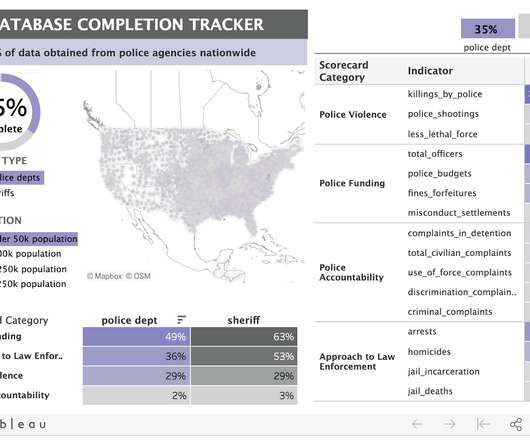
Public Affairs Specialist at Tableau. Visualization credit: Police Scorecard. The underlying dataset for Police Scorecard is massive: over 13 million cells of data and counting. To provide a way into understanding it, Sinyangwe and his team relied on Tableaudatavisualizations to highlight key trends in the data.
Public Affairs Specialist at Tableau. Visualization credit: Police Scorecard. The underlying dataset for Police Scorecard is massive: over 13 million cells of data and counting. To provide a way into understanding it, Sinyangwe and his team relied on Tableaudatavisualizations to highlight key trends in the data.
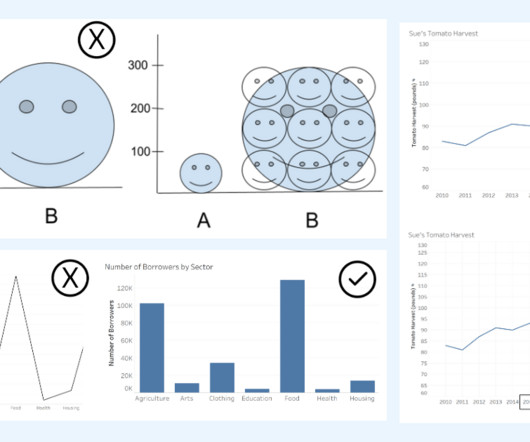
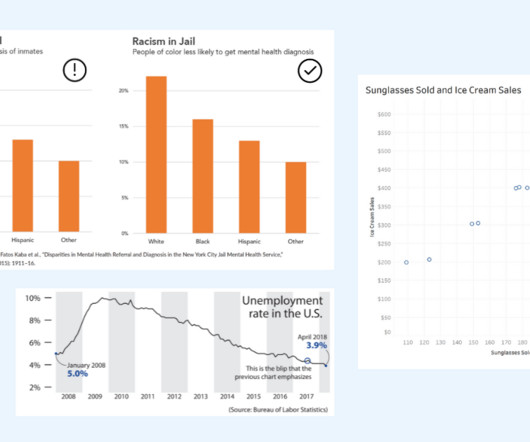
Alyssa Jenson November 14, 2023 - 6:59pm Sue Kraemer Senior Data Skills Curriculum Strategy Manager, Tableau Charts are all around us. In today’s world, the ability to swiftly make decisions and act on data is crucial. Two line graphs showing the same data with different intervals on the axis. Know the Source.
Gartner has again recognized Tableau as a Leader—for our ninth consecutive year. . I first want to thank you, the Tableau Community, for your continued support and your commitment to data, to Tableau, and to each other. With your input, we released more than 200 new capabilities across the Tableau platform in 2020.
The industry has evolved from relying on tools like SAS and R to placing a spotlight on datavisualization tools like Tableau and PowerBI. Later, Python gained momentum and surpassed all programming languages, including Java, in popularity around 2018–19.
While I created the visuals mainly in Jupyter Notebook using Matplotlib and Seaborn for direct analysis and its flexibility, in this part of the blog I also use images generated by Tableau for a polished and reader-friendly presentation. On the other hand, the purple line shows the trend of the data.
Director, Community Programs & Engagement at Tableau. We are just weeks away from Tableau Conference and the ultimate visualization showdown —Iron Viz 2021—where three fierce contestants will take the virtual stage for an intense lightning round of live viz-tastic storytelling. . Andrew Grinaker. Ateken Abla. October 21, 2021.
Director, Community Programs & Engagement at Tableau. We are just weeks away from Tableau Conference and the ultimate visualization showdown —Iron Viz 2021—where three fierce contestants will take the virtual stage for an intense lightning round of live viz-tastic storytelling. . Andrew Grinaker. Ateken Abla. October 21, 2021.
Image by Author Tools The following tools were used to assist the data analysis process: Tableau: Used to create the visualizations. JupyterHub: Used to wrangle, clean, and prepare the dataset for visualization. Remove erroneous values. Create a new CSV file based on the newly cleaned dataset.
Visualizing the risks . Kelly and her team at Headwaters Economics used Tableau to create two powerful dashboards to visualize the inequitable realities of wildfire risk and help decision makers find solutions. Initial prototypes in 2017 and 2018 focused on Santa Fe, New Mexico, and Austin, Texas , respectively. “We
Ateken Abla November 14, 2023 - 6:59pm Sue Kraemer Senior Data Skills Curriculum Strategy Manager, Tableau Charts exist everywhere. Viewing a chart instead of a table of numbers helps us quickly understand data, see patterns, and make better decisions. In today’s world, swift decision-making with data is crucial.
Visualizing the risks. Kelly and her team at Headwaters Economics used Tableau to create two powerful dashboards to visualize the inequitable realities of wildfire risk and help decision makers find solutions. Initial prototypes in 2017 and 2018 focused on Santa Fe, New Mexico, and Austin, Texas , respectively. “We
Two of the platforms that we see emerging as a popular combination of data warehousing and business intelligence are the Snowflake Data Cloud and Power BI. Debuting in 2015, Power BI has undergone meaningful updates that have made it a leader not just in datavisualization, but in the business intelligence space as well.
Key Skills Need a Mention As a Data Scientist, you should master certain skill sets. Some of these specialism are: Python TensorFlow SQL Tableau PowerBI Keras Matlab Spark R HTML/CSS/JS Finding You Another aspect that you should look into is who can reach you. Here you will get the profile URL.
The field of data science has evolved dramatically over the past several years, driven by technological breakthroughs, industry demands, and shifting priorities within the community. By analyzing conference session titles and abstracts from 2018 to 2024, we can trace the rise and fall of key trends that shaped the industry.
We organize all of the trending information in your field so you don't have to. Join 17,000+ users and stay up to date on the latest articles your peers are reading.
You know about us, now we want to get to know you!
Let's personalize your content
Let's get even more personalized
We recognize your account from another site in our network, please click 'Send Email' below to continue with verifying your account and setting a password.


Let's personalize your content