Remove 2020 Remove Data Modeling Remove Data Visualization
article thumbnail

Tableau: 9 years a Leader in Gartner Magic Quadrant for Analytics and Business Intelligence Platforms

Tableau

With your input, we released more than 200 new capabilities across the Tableau platform in 2020. In every release, we're making Tableau easier to use, more powerful, and simpler to deploy to support governed data and analytics at scale. In 2020, we added the ability to write to external databases so you can use clean data anywhere.

Tableau 102
article thumbnail

How to Optimize Power BI and Snowflake for Advanced Analytics

phData

Two of the platforms that we see emerging as a popular combination of data warehousing and business intelligence are the Snowflake Data Cloud and Power BI. Having gone public in 2020 with the largest tech IPO in history, Snowflake continues to grow rapidly as organizations move to the cloud for their data warehousing needs.

professionals

Sign Up for our Newsletter

This site is protected by reCAPTCHA and the Google Privacy Policy and Terms of Service apply.

article thumbnail

Analyzing the history of Tableau innovation

Tableau

April 2018), which focused on users who do understand joins and curating federated data sources. May 2020) shifted sheets to a multiple-table data model, where the sheet’s fields allow the computer to write much more efficient queries to the data sources. Relationships in Tableau 2020.2 (May

Tableau 145
article thumbnail

Tableau: 9 years a Leader in Gartner Magic Quadrant for Analytics and Business Intelligence Platforms

Tableau

With your input, we released more than 200 new capabilities across the Tableau platform in 2020. In every release, we're making Tableau easier to use, more powerful, and simpler to deploy to support governed data and analytics at scale. In 2020, we added the ability to write to external databases so you can use clean data anywhere.
Tableau 52
article thumbnail

Analyzing the history of Tableau innovation

Tableau

April 2018), which focused on users who do understand joins and curating federated data sources. May 2020) shifted sheets to a multiple-table data model, where the sheet’s fields allow the computer to write much more efficient queries to the data sources. Relationships in Tableau 2020.2 (May

Tableau 98
article thumbnail

Navigating the 2024 Data Analyst career growth landscape

Pickl AI

Join me in understanding the pivotal role of Data Analysts , where learning is not just an option but a necessity for success. Key takeaways Develop proficiency in Data Visualization, Statistical Analysis, Programming Languages (Python, R), Machine Learning, and Database Management.

article thumbnail

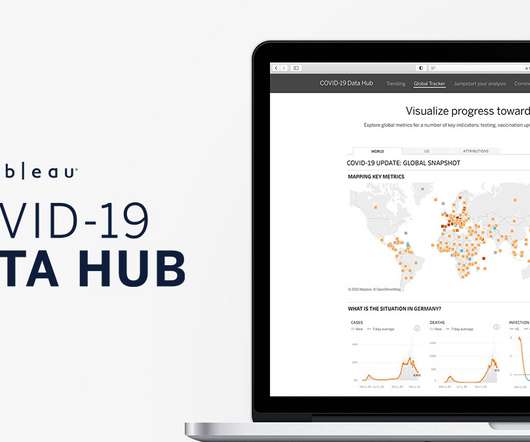
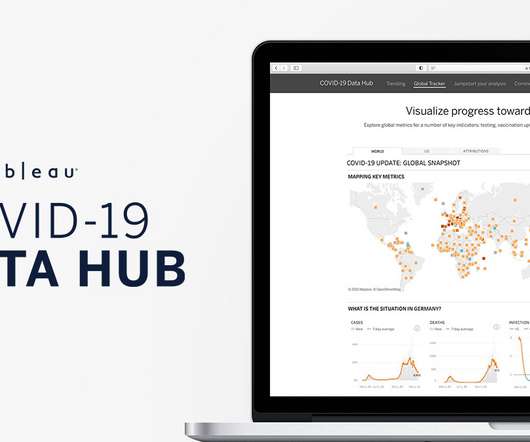
New COVID-19 Global Tracker measures progress toward recovery

Tableau

Our new Global Tracker pulls information from multiple data sources into one visualization, updated daily, allowing people to see and interact with those data to inform individual behavior, business decisions, and government policy. . . Different data sources, one data visualization: the power of Prep Builder.

Tableau 98