This site uses cookies to improve your experience. To help us insure we adhere to various privacy regulations, please select your country/region of residence. If you do not select a country, we will assume you are from the United States. Select your Cookie Settings or view our Privacy Policy and Terms of Use.
Cookie Settings
Cookies and similar technologies are used on this website for proper function of the website, for tracking performance analytics and for marketing purposes. We and some of our third-party providers may use cookie data for various purposes. Please review the cookie settings below and choose your preference.
Used for the proper function of the website
Used for monitoring website traffic and interactions
Cookie Settings
Cookies and similar technologies are used on this website for proper function of the website, for tracking performance analytics and for marketing purposes. We and some of our third-party providers may use cookie data for various purposes. Please review the cookie settings below and choose your preference.
Strictly Necessary: Used for the proper function of the website
Performance/Analytics: Used for monitoring website traffic and interactions
Introduction 2021 is a year that proved nothing is better than a Proof of Work to evaluate any candidate’s worth, initiative, and skill. Pursuing any data science project will help you polish your resume. The post Top Data Science Projects to add to your Portfolio in 2021 appeared first on Analytics Vidhya.
The post Top Data Science Guest Authors of 2021 appeared first on Analytics Vidhya. From the latest developments to guiding people through the thorns of career, Analytics Vidhya has it all in its blog archives. And this would not have been possible without leveraging the power of the […].
ArticleVideo Book This article was published as a part of the Data Science Blogathon. Topic to be covered What is Exploratory Data Analysis What. The post Top Python Libraries to Automate Exploratory Data Analysis in 2021 appeared first on Analytics Vidhya.
ArticleVideo Book This article was published as a part of the Data Science Blogathon Introduction Cryptocurrency serves as a digital asset and is a medium. The post Analysing the Cryptocurrency of May 2021 | Python for Finance basics appeared first on Analytics Vidhya.
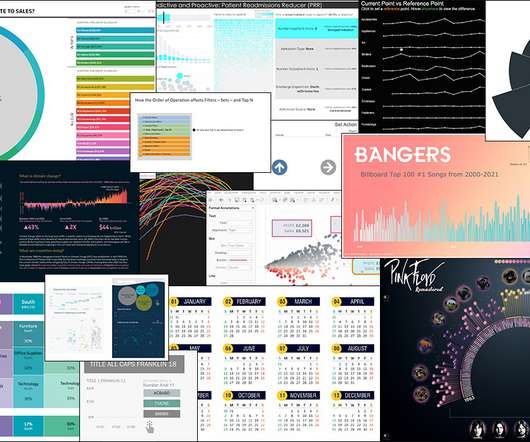
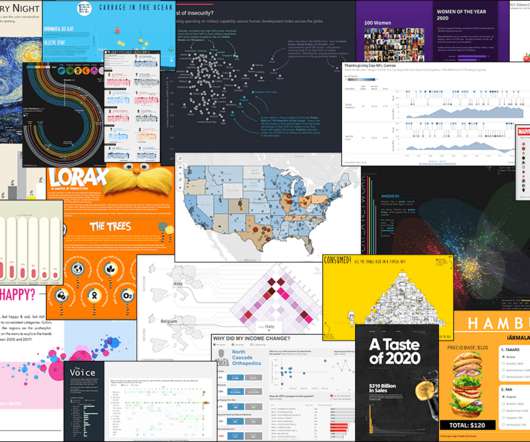
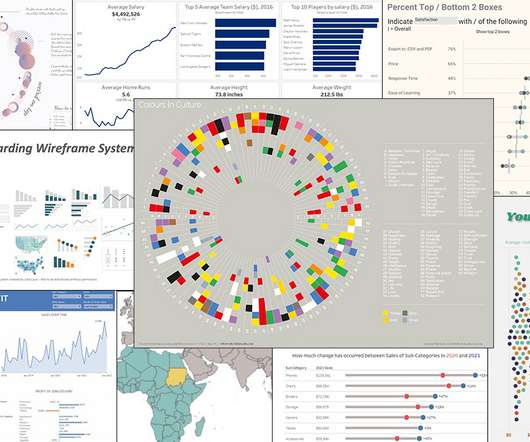
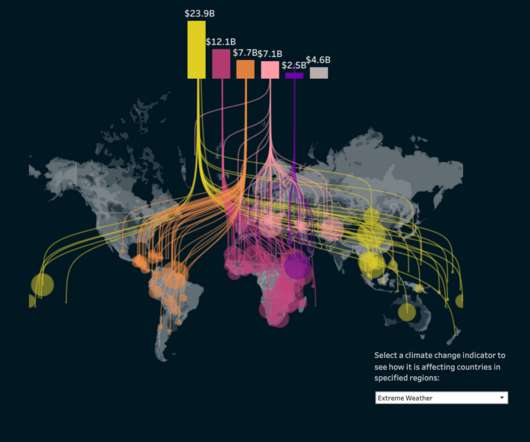
These are my favorite datavisualization projects from 2021. Phew, just made it. Like last year, there were many Covid-related charts on the internets this year. While they are important to gauge the state of things, I found myself veering away from them to focus on other areas.
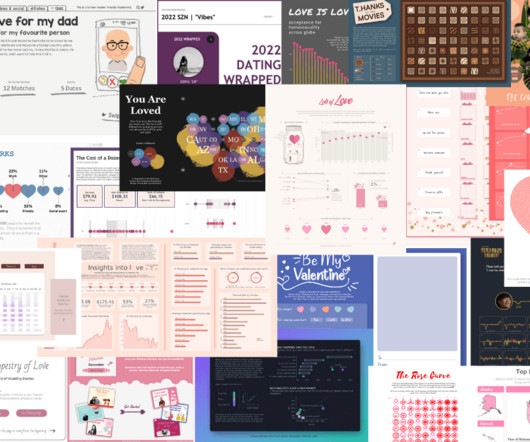
At the end of 2022, I embarked on a personal project to track my dating experiences throughout the year, leading to a laugh-out-loud visualization that captured a rollercoaster of emotions. Each visualization provides a fresh perspective on the timeless theme of love. If you love movies, join in on Tableau's Data + Movies challenge.
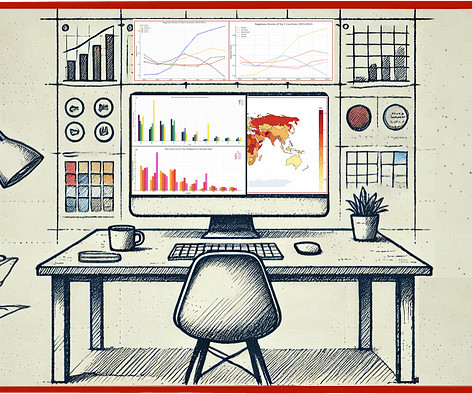
Can it do decent quantitative analysis from a datavisualization? For me, one of the most useful GPT-4 tools is the ability to analyze and interpret image data. But how good it this tool now with charting data and with map images? Join thousands of data leaders on the AI newsletter. This member-only story is on us.
Can it do decent quantitative analysis from a datavisualization? For me, one of the most useful GPT-4 tools is the ability to analyze and interpret image data. But how good it this tool now with charting data and with map images? Join thousands of data leaders on the AI newsletter. This member-only story is on us.
November 6, 2021 - 2:57am. November 6, 2021. In just a few days, we’ll all be watching—and I’ll be co-hosting for the fourth time— Iron Viz , the ultimate visualization showdown, at #Data21. Gary Li , The Data School Australia. Overcoming DataVisualization Impostor Syndrome. Andy Cotgreave. Bronwen Boyd.
June 1, 2021 - 10:49pm. June 2, 2021. The ultimate data showdown is back. Data rockstars (like you!) Earn the humble-bragging rights that come with qualifying for the world’s largest datavisualization contest. . Here’s how it works: Submit a visualization that aligns with the qualifier theme to enter.
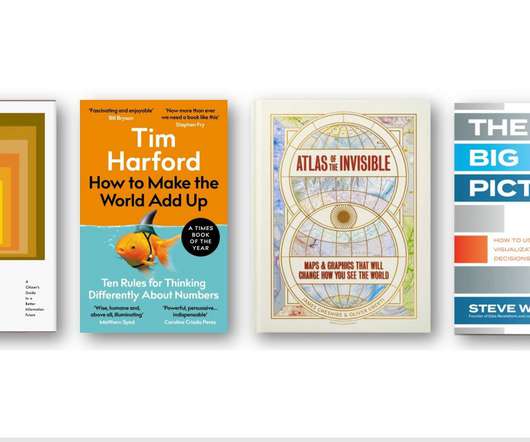
December 11, 2021 - 11:00pm. December 12, 2021. Andy Cotgreave—dataIQ Top 100 in data2021, author of Big Book of Dashboards and Tableau technical evangelist—shares his top data-related books from this year. the book is called The Data Detective. version came out in 2021. Andy Cotgreave.
April 3, 2021 - 1:03pm. April 3, 2021. Always pushing the limits of what the tool is capable of, showing the world the power of data, and challenging thinking about the world of analytics and datavisualization. Mark Bradbourne. National Solutions Engineer. Kristin Adderson.
September 30, 2021 - 4:55pm. October 2, 2021. If you’ve ever had a conversation with me about datavisualization, you know I’m passionate about color usage. Mark Bradbourne. National Solutions Engineer, Tableau . Bronwen Boyd. If used incorrectly, preattentive attributes can be as much a blessing as a curse.
December 11, 2021 - 1:33am. December 11, 2021. Tune into Tableau Conference 2021 on-demand. My highlights from Tableau Conference 2021. Tableau Conference 2021 Recap #data21. Sarah Bartlett , Sarah Loves Data. Visualizations. Mark Bradbourne. National Solutions Engineer, Tableau. Bronwen Boyd.
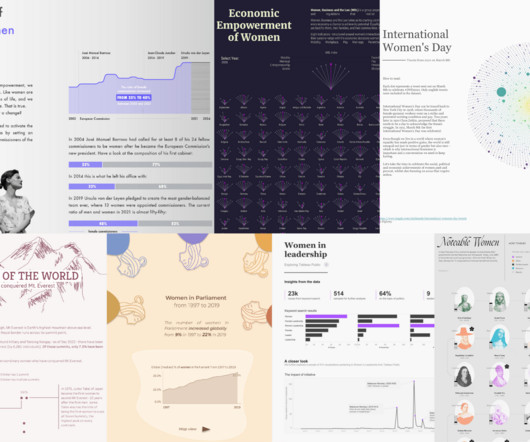
In the age of data-driven insights, it's fitting to explore how datavisualization can be a powerful tool in telling the stories of women's achievements, struggles, and progress. You could also visualize social issues that impact women such as the gender pay gap, healthcare, or female representation in politics."
December 11, 2021 - 11:00pm. December 12, 2021. Andy Cotgreave—dataIQ Top 100 in data2021, author of Big Book of Dashboards and Tableau technical evangelist—shares his top data-related books from this year. the book is called The Data Detective. version came out in 2021. Andy Cotgreave.
November 6, 2021 - 2:57am. November 6, 2021. In just a few days, we’ll all be watching—and I’ll be co-hosting for the fourth time— Iron Viz , the ultimate visualization showdown, at Tableau Conference. Gary Li , The Data School Australia. Overcoming DataVisualization Impostor Syndrome. Andy Cotgreave.
December 11, 2021 - 1:33am. December 11, 2021. Tune into Tableau Conference 2021 on-demand. My highlights from Tableau Conference 2021. Tableau Conference 2021 Recap #data21. Sarah Bartlett , Sarah Loves Data. Visualizations. Mark Bradbourne. National Solutions Engineer, Tableau. Bronwen Boyd.
November 12, 2021 - 12:25am. November 12, 2021. Tableau celebrated its 14th annual Tableau Conference—and the largest data party of the year drew data rockstars from all over the globe to learn, connect, and be inspired by their peers, experts, and thought leaders. Kristin Adderson.
August 20, 2021 - 10:08pm. August 21, 2021. Last week I had the honor of announcing the winners of the 2021 Iron Viz feeder competition. Correctly using color in datavisualizations is an important skill. Andy Cotgreave. Technical Evangelist Director, Tableau. Bronwen Boyd. Color: use with intent.
5 Tips to Visually Enhance your Tableau DataVisualizations. Improving business performance through data literacy. 2021: A Reflection. Sarah Bartlett , Sarah Loves Data. Farewell #SportsVizSunday. Spencer Baucke. Saba Gebreyohannes , Biztory. Let’s visualise #WorkoutWednesday submissions.
November 12, 2021 - 12:25am. November 12, 2021. Tableau celebrated its 14th annual Tableau Conference—and the largest data party of the year drew data rockstars from all over the globe to learn, connect, and be inspired by their peers, experts, and thought leaders. Kristin Adderson.
September 30, 2021 - 4:55pm. October 2, 2021. If you’ve ever had a conversation with me about datavisualization, you know I’m passionate about color usage. Mark Bradbourne. National Solutions Engineer, Tableau. Bronwen Boyd. If used incorrectly, preattentive attributes can be as much a blessing as a curse.
March 29, 2021 - 9:46pm. March 29, 2021. We want it to reflect the work of our partners and the strides they are taking to make the world a better place with data. . Hear from Feeding America about how they use datavisualization to understand and meet the growing need for food assistance during the pandemic. .
August 20, 2021 - 10:08pm. August 21, 2021. Last week I had the honor of announcing the winners of the 2021 Iron Viz feeder competition. Correctly using color in datavisualizations is an important skill. Andy Cotgreave. Technical Evangelist Director, Tableau. Bronwen Boyd. Color: use with intent.
In fact, the demand for data experts is expected to grow by 36% between 2021 and 2031, significantly higher than the average for all occupations. This is great news for anyone who is interested in a career in data science. Hands-on projects : You will have the opportunity to work on real-world data science projects.
November 10, 2021 - 1:09am. November 10, 2021. It wouldn't be Tableau Conference without the world’s ultimate data showdown—Iron Viz. Three fierce contestants took the virtual stage to rock day two with some visualization madness. This officially ends 2021 Iron Viz. Andrew Grinaker. Ateken Abla.
November 10, 2021 - 1:09am. November 10, 2021. It wouldn't be Tableau Conference without the world’s ultimate data showdown—Iron Viz. Three fierce contestants took the virtual stage to rock day two with some visualization madness. This officially ends 2021 Iron Viz. Andrew Grinaker. Ateken Abla.
February 12, 2021 - 4:30pm. February 13, 2021. She smartly addresses problems that all of us in the data world have experienced, but the cool thing is she wrote about it and that resonated with readers and community members. Mark Bradbourne. Lead Solution Engineer. Kristin Adderson. Hello, DataFam!
5 Tips to Visually Enhance your Tableau DataVisualizations. Improving business performance through data literacy. 2021: A Reflection. Sarah Bartlett , Sarah Loves Data. Farewell #SportsVizSunday. Spencer Baucke. Saba Gebreyohannes , Biztory. Let’s visualise #WorkoutWednesday submissions.
As the amount of data continues to grow, the demand for data scientists is expected to increase even further. According to the US Bureau of Labor Statistics , the demand for data scientists is projected to grow 36% from 2021 to 2031, much faster than the average for all occupations.
July 19, 2021 - 11:09pm. July 20, 2021. Data skills are important for all. Our mission is to lower the barrier of entry to learning analytics and build data literacy skills in future generations. . In partnership with AICTE, we will help equip the future workforce of India with these critical data skills.
April 3, 2021 - 1:03pm. April 3, 2021. Always pushing the limits of what the tool is capable of, showing the world the power of data, and challenging thinking about the world of analytics and datavisualization. Mark Bradbourne. National Solutions Engineer. Kristin Adderson.
June 1, 2021 - 10:49pm. June 2, 2021. The ultimate data showdown is back. Data rockstars (like you!) Earn the humble-bragging rights that come with qualifying for the world’s largest datavisualization contest. . Here’s how it works: Submit a visualization that aligns with the qualifier theme to enter.
In the early days of analytics, only the largest companies could afford to leverage big data. But which tools are the most effective for businesses in 2021? Here’s more on why data is so important for companies and the top 5 analytics tools they’re using this year to stay ahead of the curve and their competition.
Ateken Abla March 19, 2024 - 9:05pm Larissa Amoroso Vice President, Tableau Community, Tableau When Karolina Grodzinska took the stage at Tableau Conference as part of her Iron Viz: Student Edition award, it felt like the culmination of her data learning, which started in 2021. Winning Iron Viz: Student Edition is no small feat.
Senior DataVisualization Lead, Excella. March 5, 2021 - 1:37am. March 9, 2021. Once we find issues of inequality in data, it’s also our responsibility to spend time to understand the causes of those inequalities.” - Amanda Makulec. Amanda Makulec. Kristin Adderson.
While machine learning frameworks and platforms like PyTorch, TensorFlow, and scikit-learn can perform data exploration well, it’s not their primary intent. There are also plenty of datavisualization libraries available that can handle exploration like Plotly, matplotlib, D3, Apache ECharts, Bokeh, etc.
February 17, 2021 - 7:09pm. February 17, 2021. Datavisualization is a collaborative exercise. JMU’s commitment to data transparency, through both university- and self-reported cases, has contributed to more than 540,000 views of its COVID-19 dashboard as of February 2021. . Kristin Adderson.
July 19, 2021 - 11:09pm. July 20, 2021. Data skills are important for all. Our mission is to lower the barrier of entry to learning analytics and build data literacy skills in future generations. In partnership with AICTE, we will help equip the future workforce of India with these critical data skills.
February 12, 2021 - 4:30pm. February 13, 2021. She smartly addresses problems that all of us in the data world have experienced, but the cool thing is she wrote about it and that resonated with readers and community members. Mark Bradbourne. Lead Solution Engineer. Kristin Adderson. Hello, DataFam!
January 8, 2021 - 3:49pm. January 8, 2021. Bridge the data literacy gap for students in academia. Working with data is a necessity for most jobs, and analytical skills can be a huge differentiator for success across all kinds of work—whether corporate, nonprofit, or academic. Sue Kraemer. Kristin Adderson.
May 6, 2021 - 5:49pm. May 6, 2021. Developed with USC’s Equity Research Institute , the Atlas is one of the most powerful resources for data on racial inequities in the country. The Lab is designed as a comprehensive datavisualization resource for organizers working for racial equity and justice. Neal Myrick.
March 29, 2021 - 9:46pm. March 29, 2021. We want it to reflect the work of our partners and the strides they are taking to make the world a better place with data. . Hear from Feeding America about how they use datavisualization to understand and meet the growing need for food assistance during the pandemic. .
We organize all of the trending information in your field so you don't have to. Join 17,000+ users and stay up to date on the latest articles your peers are reading.
You know about us, now we want to get to know you!
Let's personalize your content
Let's get even more personalized
We recognize your account from another site in our network, please click 'Send Email' below to continue with verifying your account and setting a password.


Let's personalize your content