This site uses cookies to improve your experience. To help us insure we adhere to various privacy regulations, please select your country/region of residence. If you do not select a country, we will assume you are from the United States. Select your Cookie Settings or view our Privacy Policy and Terms of Use.
Cookie Settings
Cookies and similar technologies are used on this website for proper function of the website, for tracking performance analytics and for marketing purposes. We and some of our third-party providers may use cookie data for various purposes. Please review the cookie settings below and choose your preference.
Used for the proper function of the website
Used for monitoring website traffic and interactions
Cookie Settings
Cookies and similar technologies are used on this website for proper function of the website, for tracking performance analytics and for marketing purposes. We and some of our third-party providers may use cookie data for various purposes. Please review the cookie settings below and choose your preference.
Strictly Necessary: Used for the proper function of the website
Performance/Analytics: Used for monitoring website traffic and interactions
Technical Evangelist Director, Tableau. November 6, 2021 - 2:57am. November 6, 2021. Welcome to Best of Tableau Web! In just a few days, we’ll all be watching—and I’ll be co-hosting for the fourth time— Iron Viz , the ultimate visualization showdown, at #Data21. Klassen and Tudorancea/Tableau Public].
National Solutions Engineer, Tableau . September 30, 2021 - 4:55pm. October 2, 2021. If you’ve ever had a conversation with me about datavisualization, you know I’m passionate about color usage. Henry Mark/The Data School UK]. How to Isolate Linear Regression Equations in Tableau. Mark Bradbourne.
National Solutions Engineer, Tableau. December 11, 2021 - 1:33am. December 11, 2021. Fresh off of Tableau Conference , we are back with the Best of the Tableau Web! Tune into Tableau Conference 2021 on-demand. Scroll down for Tableau Zen Masters Share Their Best Advice.). Mark Bradbourne.
November 12, 2021 - 12:25am. November 12, 2021. Tableau celebrated its 14th annual Tableau Conference—and the largest data party of the year drew data rockstars from all over the globe to learn, connect, and be inspired by their peers, experts, and thought leaders. The data opportunity ahead.
April 3, 2021 - 1:03pm. April 3, 2021. Welcome to our monthly highlight of tips, tricks and inspiration produced by the Tableau Community. The Tableau Community and the DataFam never cease to amaze me. David Pires on Rethinking DataVisualization , image credit: Antler How design thinking can shape your business idea. .
Kathleen VanDerAa February 13, 2024 - 7:06pm Dzifa Amexo Tableau Ambassador Hello, love! My name is Dzifa Amexo and I am a Tableau Social Ambassador and co-lead the BLK in D&A, NYC, and FinServ Tableau User Groups. Each visualization provides a fresh perspective on the timeless theme of love. Take the challenge.
Technical Evangelist Director, Tableau. November 6, 2021 - 2:57am. November 6, 2021. Welcome to Best of Tableau Web! In just a few days, we’ll all be watching—and I’ll be co-hosting for the fourth time— Iron Viz , the ultimate visualization showdown, at Tableau Conference. Felicia Styer , Playfair Data.
National Solutions Engineer, Tableau. December 11, 2021 - 1:33am. December 11, 2021. Fresh off of Tableau Conference , we are back with the Best of the Tableau Web! Tune into Tableau Conference 2021 on-demand. Scroll down for Tableau Zen Masters Share Their Best Advice.). Mark Bradbourne.
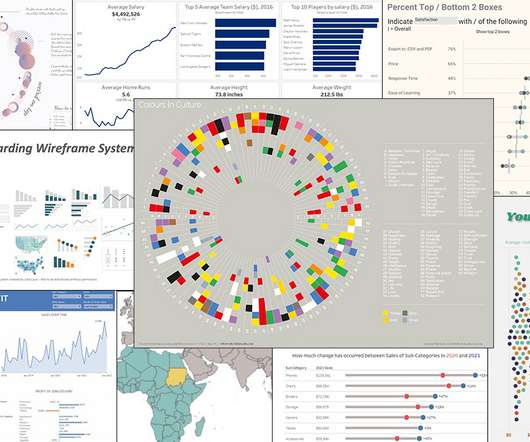
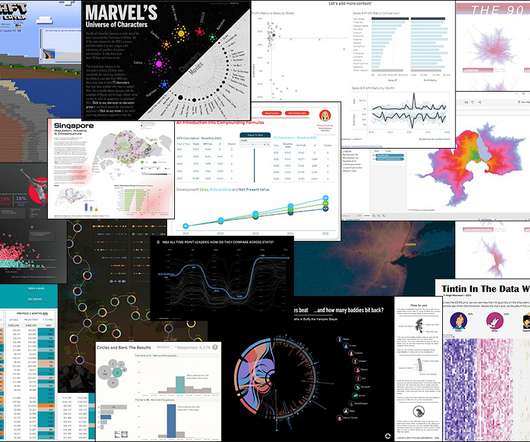
Technical Evangelist Director, Tableau. The Flerlage Twins take a longer view and look at their ten favourite Tableau Public vizzes of all time. Nicole Klassan and Oana Tudorancea's visualization for #VizCollab. Click to view their full visualization on Tableau Public. Tips for Collaborating in Tableau.
July 19, 2021 - 11:09pm. July 20, 2021. Data skills are important for all. It’s one of our guiding principles at Tableau and why we support students and instructors around the globe through Tableau Academic Programs. Data skills are also interdisciplinary. Manager, APJ Community. Kristin Adderson.
November 12, 2021 - 12:25am. November 12, 2021. Tableau celebrated its 14th annual Tableau Conference—and the largest data party of the year drew data rockstars from all over the globe to learn, connect, and be inspired by their peers, experts, and thought leaders. The data opportunity ahead.
National Solutions Engineer, Tableau. September 30, 2021 - 4:55pm. October 2, 2021. If you’ve ever had a conversation with me about datavisualization, you know I’m passionate about color usage. Henry Mark/The Data School UK]. How to Isolate Linear Regression Equations in Tableau. Mark Bradbourne.
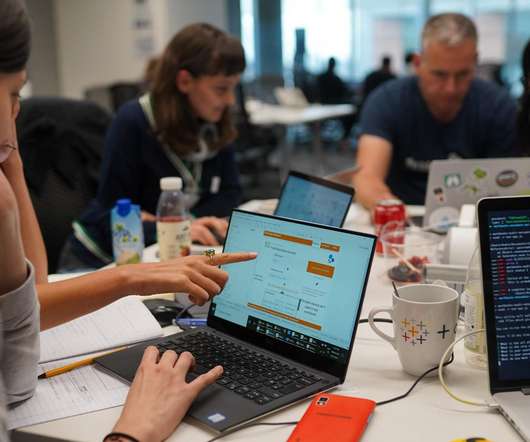
Ateken Abla March 19, 2024 - 9:05pm Larissa Amoroso Vice President, Tableau Community, Tableau When Karolina Grodzinska took the stage at Tableau Conference as part of her Iron Viz: Student Edition award, it felt like the culmination of her data learning, which started in 2021. How did Karolina discover Tableau? “It
Technical Evangelist Director, Tableau. The Flerlage Twins take a longer view and look at their ten favourite Tableau Public vizzes of all time. Nicole Klassan and Oana Tudorancea's visualization for #VizCollab. Click to view their full visualization on Tableau Public. Tips for Collaborating in Tableau.
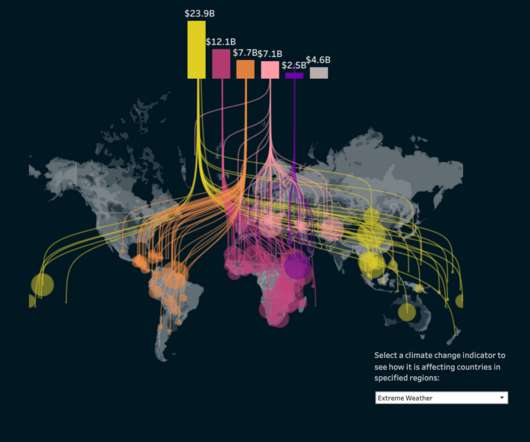
Technical Fellow, Tableau. December 1, 2021 - 11:06pm. December 2, 2021. Innovation is necessary to use data effectively in the pursuit of a better world, particularly because data continues to increase in size and richness. Click to view the full interactive visualization. Jock Mackinlay. Bronwen Boyd.
Senior Manager, Community Programs & Engagement at Tableau. June 1, 2021 - 10:49pm. June 2, 2021. The ultimate data showdown is back. Data rockstars (like you!) Earn the humble-bragging rights that come with qualifying for the world’s largest datavisualization contest. . Andrew Grinaker. Ateken Abla.
Chief Product Officer, Tableau. October 8, 2021 - 11:41pm. October 12, 2021. It's more important than ever in this all digital, work from anywhere world for organizations to use data to make informed decisions. However, most organizations struggle to become data driven. Francois Ajenstat. Spencer Czapiewski.
March 29, 2021 - 9:46pm. March 29, 2021. Every year that the Tableau Foundation team has hosted the Tableau Foundation Summit, we have chosen the event theme thoughtfully. We want it to reflect the work of our partners and the strides they are taking to make the world a better place with data. . Jason Schumacher.
Tableau Academic Programs Instructional Designer. January 8, 2021 - 3:49pm. January 8, 2021. Bridge the data literacy gap for students in academia. Without closing the data skills gap, these challenges would continue into their professional lives. Learning how to communicate with data . Sue Kraemer.
Product Manager, Tableau. November 16, 2021 - 6:00am. November 16, 2021. Tableau Public provides a place for the global data community to develop data skills and, in turn, foster Data Culture. Like any thriving economy, we’re investing to help the Tableau Economy grow. Alex Novelli.
February 12, 2021 - 4:30pm. February 13, 2021. Welcome to my first edition of Best of the Tableau Web (BOTW), where I’ll recap highlights from last month. For me, the Tableau Community has been a treasure trove of content that’s both highly inspirational and technically deep. by Bridget Cogley, Tableau Zen Master.
Senior Solution Engineer, Tableau. Welcome to Best of Tableau Web—a monthly highlight of tips, tricks, and inspiration from across the internet on Tableau and datavisualization. A leader on the Tableau Solution Engineering team asked me to record a short video about why I love data for our recent team meeting.
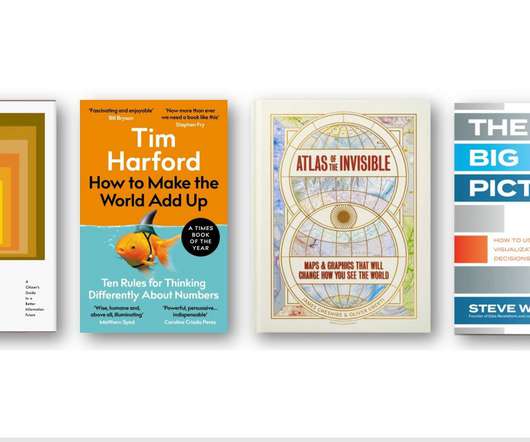
Technical Evangelist Director, Tableau. December 11, 2021 - 11:00pm. December 12, 2021. Andy Cotgreave—dataIQ Top 100 in data2021, author of Big Book of Dashboards and Tableau technical evangelist—shares his top data-related books from this year. Living in Data. Living in Data , Jer Thorp.
Product Manager, Tableau. November 16, 2021 - 6:00am. November 16, 2021. Tableau Public provides a place for the global data community to develop data skills and, in turn, foster Data Culture. Like any thriving economy, we’re investing to help the Tableau Economy grow. Alex Novelli.
Guest author, Tableau DataDev Ambassador. November 30, 2021 - 4:55am. November 30, 2021. Tableau is an innovator in the field of datavisualization with its ease of use, stunning visualizations, vibrant community, and more contributing to success. Why does open source matter for Tableau?
July 19, 2021 - 11:09pm. July 20, 2021. Data skills are important for all. It’s one of our guiding principles at Tableau and why we support students and instructors around the globe through Tableau Academic Programs. Data skills are also interdisciplinary. Manager, APJ Community. Kristin Adderson.
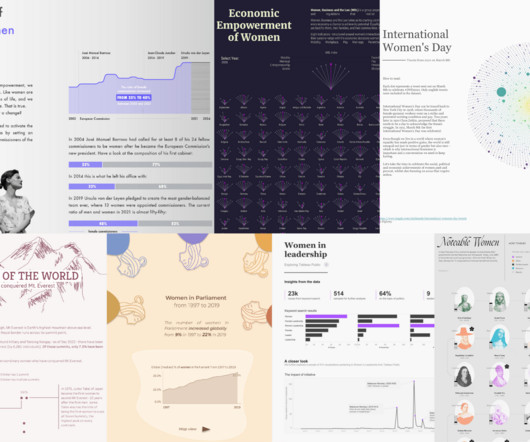
In the age of data-driven insights, it's fitting to explore how datavisualization can be a powerful tool in telling the stories of women's achievements, struggles, and progress. Don’t forget to star your favorites and follow these authors on Tableau Public. For example, this month's Iron Quest theme is women.
Senior Solution Engineer, Tableau. Welcome to Best of Tableau Web—a monthly highlight of tips, tricks, and inspiration from across the internet on Tableau and datavisualization. A leader on the Tableau Solution Engineering team asked me to record a short video about why I love data for our recent team meeting.
Celebrate everything pop culture and fandoms while growing your data skills through DataFam Con , a Tableau Community datavisualization challenge—initiatives created and led by members of the DataFam community for participants to learn, practice, and apply their data skills across a variety of topics, products, and causes.
Guest author, Tableau DataDev Ambassador. November 30, 2021 - 4:55am. November 30, 2021. Tableau is an innovator in the field of datavisualization with its ease of use, stunning visualizations, vibrant community, and more contributing to success. Why does open source matter for Tableau?
Technical Evangelist Director, Tableau. August 20, 2021 - 10:08pm. August 21, 2021. Last week I had the honor of announcing the winners of the 2021 Iron Viz feeder competition. It can be tempting to go a long way and hack Tableau to create non-standard charts with deep visual appeal and a significant “wow” factor.
October 23, 2021 - 2:10pm. November 4, 2021. More organizations realized the benefits of being data-driven in the last year—how it fuels business value such as improved performance, competitive advantage, increased productivity, as well as stronger employee retention and customer satisfaction. Courtney Jacobsen.
Technical Evangelist Director, Tableau. December 11, 2021 - 11:00pm. December 12, 2021. Andy Cotgreave—dataIQ Top 100 in data2021, author of Big Book of Dashboards and Tableau technical evangelist—shares his top data-related books from this year. Living in Data. Living in Data , Jer Thorp.
Curriculum Development Manager, Tableau. September 2, 2021 - 1:50pm. September 2, 2021. I’m proud to announce that our ready-made Data Literacy One curriculum is now available in Canvas learning management system (LMS) format. Plus, academic institutions have an opportunity to address the growing data literacy gap.
October 23, 2021 - 2:10pm. November 4, 2021. More organizations realized the benefits of being data-driven in the last year—how it fuels business value such as improved performance, competitive advantage, increased productivity, as well as stronger employee retention and customer satisfaction. Courtney Jacobsen.
January 27, 2021 - 4:36pm. February 18, 2021. This week, Gartner published the 2021 Magic Quadrant for Analytics and Business Intelligence Platforms. Gartner has again recognized Tableau as a Leader—for our ninth consecutive year. . People love Tableau because it’s powerful, yet intuitive.
Curriculum Development Manager, Tableau. September 2, 2021 - 1:50pm. September 2, 2021. I’m proud to announce that our ready-made Data Literacy One curriculum is now available in Canvas learning management system (LMS) format. Plus, academic institutions have an opportunity to address the growing data literacy gap.
May 13, 2021 - 3:14pm. May 13, 2021. Editor's note: This article originally appeared in Tableau Public. When you want to explore, create, and share datavisualizations, we're happy to share that you can start creating vizzes directly from a browser on Tableau Public with the web authoring beta.
Technical Fellow, Tableau. December 1, 2021 - 11:06pm. December 2, 2021. Innovation is necessary to use data effectively in the pursuit of a better world, particularly because data continues to increase in size and richness. Click to view the full interactive visualization. Jock Mackinlay. Bronwen Boyd.
Technical Evangelist Director, Tableau. August 20, 2021 - 10:08pm. August 21, 2021. Last week I had the honor of announcing the winners of the 2021 Iron Viz feeder competition. It can be tempting to go a long way and hack Tableau to create non-standard charts with deep visual appeal and a significant “wow” factor.
Chief Product Officer, Tableau. October 8, 2021 - 11:41pm. October 12, 2021. It's more important than ever in this all digital, work from anywhere world for organizations to use data to make informed decisions. However, most organizations struggle to become data driven. Francois Ajenstat. Spencer Czapiewski.
Director, Community Programs & Engagement at Tableau. November 10, 2021 - 1:09am. November 10, 2021. It wouldn't be Tableau Conference without the world’s ultimate data showdown—Iron Viz. Three fierce contestants took the virtual stage to rock day two with some visualization madness. Andrew Grinaker.
Director, Community Programs & Engagement at Tableau. November 10, 2021 - 1:09am. November 10, 2021. It wouldn't be Tableau Conference without the world’s ultimate data showdown—Iron Viz. Three fierce contestants took the virtual stage to rock day two with some visualization madness. Andrew Grinaker.
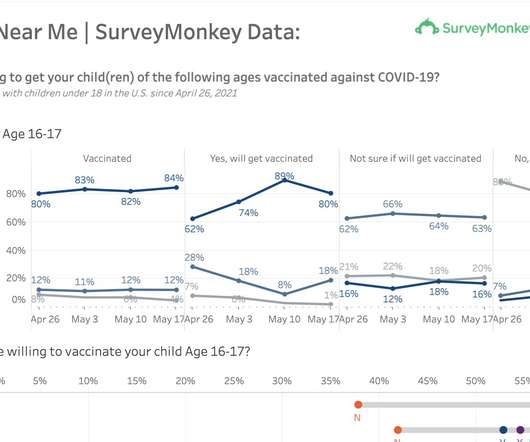
Director, Public Affairs at Tableau. May 25, 2021 - 2:44am. May 25, 2021. A new Tableau dashboard featuring data from a poll conducted by SurveyMonkey and Outbreaks Near Me , an initiative of Boston Children’s Hospital, captures parents’ opinions—and how they are changing over time. —to Steve Schwartz.
We organize all of the trending information in your field so you don't have to. Join 17,000+ users and stay up to date on the latest articles your peers are reading.
You know about us, now we want to get to know you!
Let's personalize your content
Let's get even more personalized
We recognize your account from another site in our network, please click 'Send Email' below to continue with verifying your account and setting a password.


Let's personalize your content