This site uses cookies to improve your experience. To help us insure we adhere to various privacy regulations, please select your country/region of residence. If you do not select a country, we will assume you are from the United States. Select your Cookie Settings or view our Privacy Policy and Terms of Use.
Cookie Settings
Cookies and similar technologies are used on this website for proper function of the website, for tracking performance analytics and for marketing purposes. We and some of our third-party providers may use cookie data for various purposes. Please review the cookie settings below and choose your preference.
Used for the proper function of the website
Used for monitoring website traffic and interactions
Cookie Settings
Cookies and similar technologies are used on this website for proper function of the website, for tracking performance analytics and for marketing purposes. We and some of our third-party providers may use cookie data for various purposes. Please review the cookie settings below and choose your preference.
Strictly Necessary: Used for the proper function of the website
Performance/Analytics: Used for monitoring website traffic and interactions
Introduction Power BI is one of the most popular datavisualization and analytics software product developed by Microsoft. Power BI interviews will provide insights from a variety of data by modelling data and telling stories from datavisualizations using reports and dashboards. Source: [link] […].
The post Top 7 Cloud Computing Prerequisites to Learn in 2022 appeared first on Analytics Vidhya. The scope of cloud computing is only moving faster, strength by strength, and has a brighter future ahead for everyone. There is a surging need for medium […].
In this project, we’ll dive into the historical data of Google’s stock from 2014-2022 and use cutting-edge anomaly detection techniques to uncover hidden patterns and gain insights into the stock market.
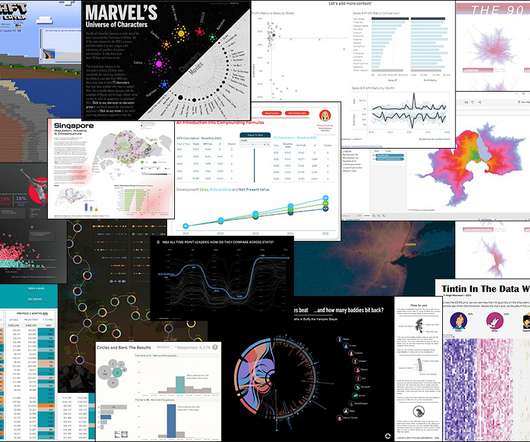
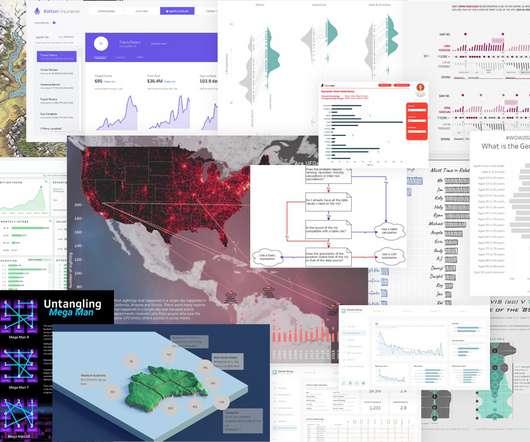
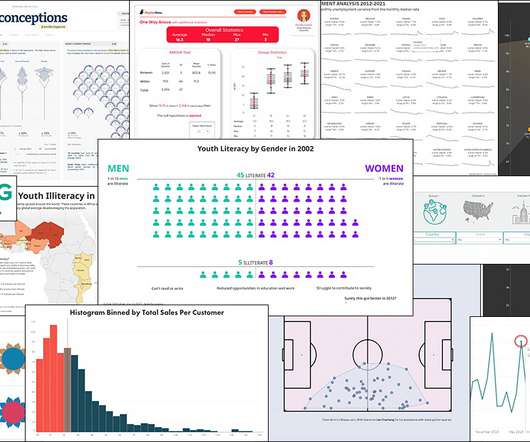
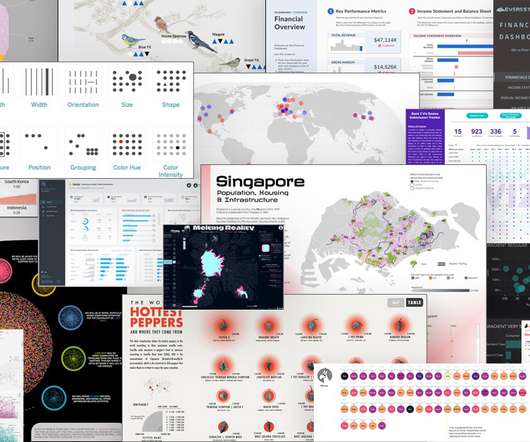
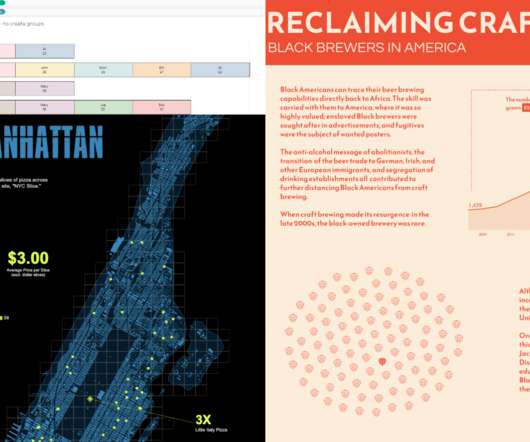
Every year, I pick my favorite datavisualization projects, which tend to cover a wide range of purposes but are typically for presentation. Here are my favorites for 2022. Read More.
The World Happiness Report rates happiness on six indicators: positive emotions, […] The post Analysing World Happiness Report (2020-2022) appeared first on Analytics Vidhya. In line with the latest World Happiness Report, it is evident that being happy has become a worldwide priority.
The post Top AI and ML Conferences in 2022 appeared first on Analytics Vidhya. This is why conferences that revolve around Artificial Intelligence (AI) are great for developers, analysts and students who wish to work with AI (build or incorporate). Participating in international conferences is one of the best ways to stay updated […].
Not just the leading technology giants in India but medium and small-scale companies are also betting on data science to revolutionize how business operations are performed. Data science is the field where large datasets are collected, analyzed, […].
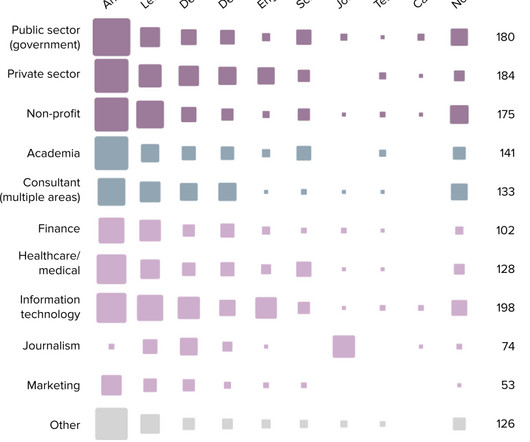
The 2022 results from the State of the Industry survey , run by the DataVisualization Society, are out. I’d have to look at the actual data, which you can get for this year and previous , but my hunch that the split distribution in salary is between non-tech and tech workers.
Top-rated data science tracks consist of multiple project-based courses covering all aspects of data. It includes an introduction to Python/R, data ingestion & manipulation, datavisualization, machine learning, and reporting.
7 Tips To Produce Readable Data Science Code • 30 Resources for Mastering DataVisualization • 15 More Free Machine Learning and Deep Learning Books • Simple and Fast Data Streaming for Machine Learning Projects • The AI Education Gap and How to Close It.
Top YouTube Channels for Learning Data Science; DataVisualization in Python with Seaborn; Deploy a Machine Learning Web App with Heroku; How to Ace Data Science Assessment Test by Using Automatic EDA Tools; Will DeepMind’s AlphaCode Replace Programmers?
There is no disputing the fact that the collection and analysis of massive amounts of unstructured data has been a huge breakthrough. We would like to talk about datavisualization and its role in the big data movement. Data is useless without the opportunity to visualize what we are looking for.
This dataset contains about 1,100 + shark bites and attempted shark bites between 1791 and early 2022, […]. After searching for a long time, I got a dataset on Shark Attacks in Australia. The post Analysis of Australian Shark Attacks appeared first on Analytics Vidhya.
It is important to learn the best business intelligence trends for 2022 because data went viral and became enormous. Spreadsheets have given way to actionable and informative datavisualizations and interactive business dashboards. And just like that, we all gained access to the cloud.
1, 2022 @mlb #baseball #dataviz ? TikTok might be the best fitting platform for his short animations focused on a single insight. Here’s an example: @chartball MLB Pitcher Report: @Atlanta Braves Spencer Strider vs. @Colorado Rockies Sept. It Was A Good Day – Ice Cube.
January 6, 2022 - 9:05pm. January 10, 2022. The ultimate data showdown is back. We are calling on data rockstars (that’s you) from around the world to compete in our annual Iron Viz competition. Earn the humble-bragging rights that come with qualifying for the world’s largest datavisualization contest. .
March 9, 2022 - 8:03pm. March 15, 2022. Welcome to Best of Tableau Web—a monthly highlight of tips, tricks, and inspiration from across the internet on Tableau and datavisualization. This past month was also Black History Month, and I was incredibly inspired by the impactful data stories shared by the community.
As technology continues to advance data generation across the world, it’s safe to say that investing in data solutions will be crucial to seeing business growth and success in 2022 and beyond. How can data help my business? There are many ways you can use data to your business’s advantage.
January 6, 2022 - 9:05pm. January 10, 2022. The ultimate data showdown is back. We are calling on data rockstars (that’s you) from around the world to compete in our annual Iron Viz competition. Earn the humble-bragging rights that come with qualifying for the world’s largest datavisualization contest.
June 2, 2022 - 7:53pm. June 4, 2022. Tableau Conference 2022 was unmistakably the latter, as summed up by Sarah Bartlett , one of the many data lovers who attended TC22 in Las Vegas last month. . Tableau Conference Highlights 2022 #data22. Sarah Bartlett , Sarah Loves Data. Ross Eaton , The Data School.
August 5, 2022 - 10:29pm. August 6, 2022. Similar to the advancements in telescope technology, datavisualizations 10 years ago were no where near the art they’ve become today. Consider every day things like television and print media—more datavisualizations are seeping into the mainstream. Bronwen Boyd.
March 9, 2022 - 8:03pm. March 15, 2022. Welcome to Best of Tableau Web—a monthly highlight of tips, tricks, and inspiration from across the internet on Tableau and datavisualization. This past month was also Black History Month, and I was incredibly inspired by the impactful data stories shared by the community.
Implementing DBSCAN in Python • How to Avoid Overfitting • Simplify Data Processing with Pandas Pipeline • How to Use DataVisualization to Add Impact to Your Work Reports and Presentations • The Data Quality Hierarchy of Needs.
August 5, 2022 - 10:29pm. August 6, 2022. Similar to the advancements in telescope technology, datavisualizations 10 years ago were no where near the art they’ve become today. Consider every day things like television and print media—more datavisualizations are seeping into the mainstream. Bronwen Boyd.
June 2, 2022 - 7:53pm. June 4, 2022. Tableau Conference 2022 was unmistakably the latter, as summed up by Sarah Bartlett , one of the many data lovers who attended TC22 in Las Vegas last month. . Tableau Conference Highlights 2022 #data22. Sarah Bartlett , Sarah Loves Data. Ross Eaton , The Data School.
September 30, 2022 - 8:07pm. October 1, 2022. This month we take things to the next level and recognize community members who have written the book(s) on data! This month we take things to the next level and recognize community members who have written the book(s) on data! . Data fundamentals. Mark Bradbourne.
September 30, 2022 - 8:07pm. October 1, 2022. This month we take things to the next level and recognize community members who have written the book(s) on data! This month we take things to the next level and recognize community members who have written the book(s) on data! . Data fundamentals. Mark Bradbourne.
June 8, 2022 - 9:06pm. June 28, 2022. Nominations and applications for the 2022 Tableau Ambassador Program are now open. You can find them answering questions in our forums, publishing content on social platforms, leading or speaking at user groups, contributing code on Github, and teaching people about datavisualization.
The file we want to download is the one highlighted below: This UN dataset models projected population growth for the years 2022 to 2100. After a quick first look, we can see that some data cleaning is in order. The actual data headers start on Row 17.
September 1, 2022 - 6:50pm. September 7, 2022. The Iron Viz finalist and fellow Aussie has been in the Tableau Community for a few years, yet only just recently started the She Will Viz blog focused on raising women’s voices in datavisualization. Caroline Yam. Community Manager, Tableau. Bronwen Boyd. Hi DataFam!
September 1, 2022 - 6:50pm. September 7, 2022. The Iron Viz finalist and fellow Aussie has been in the Tableau Community for a few years, yet only just recently started the She Will Viz blog focused on raising women’s voices in datavisualization. Caroline Yam. Community Manager, Tableau. Bronwen Boyd. Hi DataFam!
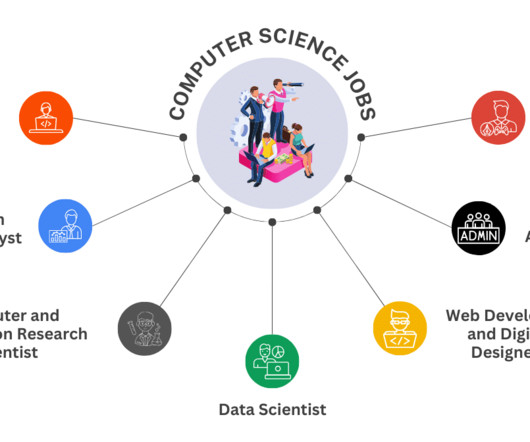
Bureau of Labor Statistics , software development jobs are projected to grow by 25% from 2022 to 2032, a rate much faster than the average for all occupations. Bureau of Labor Statistics, employment for this role is projected to grow by 32% from 2022 to 2032 , which is much faster than the average for all occupations.
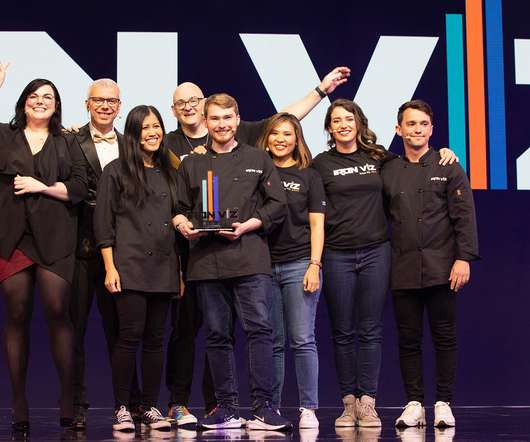
May 18, 2022 - 8:46pm. May 18, 2022. It wouldn’t be Tableau Conference without the world’s ultimate data showdown— Iron Viz. Three fierce contestants took the keynote stage to rock day two with their mad data storytelling skills. This officially ends Iron Viz 2022. Larissa Amoroso. Alyssa Jenson.
May 18, 2022 - 8:46pm. May 18, 2022. It wouldn’t be Tableau Conference without the world’s ultimate data showdown— Iron Viz. Three fierce contestants took the keynote stage to rock day two with their mad data storytelling skills. This officially ends Iron Viz 2022. Larissa Amoroso. Alyssa Jenson.
A modular approach to Python plotly range slider code creationDall-E image: Impressionist interpretation of range slider in thick, rainbow colour Datavisualization skills are an essential component of quality data analysis. Let’s prompt GPT-4 for rapid data cleaning, processing, and code generation for our sexy range slider.
How do you measure the value of adding datavisualization to your web app? If you choose to build a visualization component using a datavisualization library, what is that investment worth? You’ll be able to justify whether or not datavisualization is a sound investment that’ll reap rewards.
December 24, 2022 - 3:26am. December 28, 2022. She was drawn to visualizations around pop culture and was specifically impressed by Nicole Klassen’s Doctor Who Synopsis visualization and wanted to create a centralized effort for those who also loved talking about pop culture and fandoms while still wanting to grow their data skills.
Wells, a prominent journalist, activist, and researcher in the late 19th and early 20th centuries who pioneered data journalism. Community DataVisualization Challenges: The DataFam has launched a series of data challenges celebrating Black History Month. Data Superstar : Get ready for a datavisualization extravaganza!
Wells, a prominent journalist, activist, and researcher in the late 19th and early 20th centuries who pioneered data journalism. Community DataVisualization Challenges: The DataFam has launched a series of data challenges celebrating Black History Month. Data Superstar : Get ready for a datavisualization extravaganza!
Countless hours vizzing, a standout Tableau Public profile , and a graduate degree later, Karolina reflects on her data journey and what led her to her current role as a Business Intelligence Analyst at Schneider Electric. I already had some interest in datavisualization, I just didn't know where to start.
May 13, 2022 - 9:41pm. May 15, 2022. Iron Viz is the world’s largest datavisualization competition. Three worthy contestants take center stage in front of a global audience and have 20 minutes to deliver a compelling and awe-inspiring story using the same data set. The top ten Iron Viz qualifier entries from 2022.
May 13, 2022 - 9:41pm. May 15, 2022. Iron Viz is the world’s largest datavisualization competition. Three worthy contestants take center stage in front of a global audience and have 20 minutes to deliver a compelling and awe-inspiring story using the same data set. The top ten Iron Viz qualifier entries from 2022.
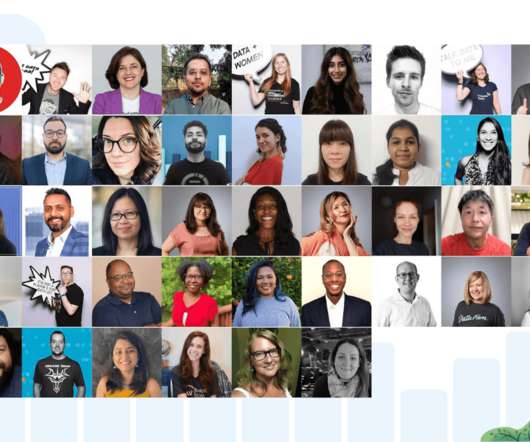
September 14, 2022 - 11:23pm. September 29, 2022. Tableau Ambassadors teach and share while fostering a positive and supportive space within the data community. Meet the 2022 Tableau Social Ambassadors. Headshots of the 44 members in the 2022 Tableau Social Ambassadors cohort. Bronwen Boyd. Britt Staniar.
September 12, 2022 - 5:08am. September 13, 2022. Tableau’s superpower is the ability to quickly turn data from a dry, obtuse data source into a rich, impactful data story. That is what datavisualization games—or “Viz Games”—are all about. . The world’s largest datavisualization competition.
We organize all of the trending information in your field so you don't have to. Join 17,000+ users and stay up to date on the latest articles your peers are reading.
You know about us, now we want to get to know you!
Let's personalize your content
Let's get even more personalized
We recognize your account from another site in our network, please click 'Send Email' below to continue with verifying your account and setting a password.


Let's personalize your content