Remove 2022 Remove Data Visualization Remove ETL
article thumbnail

What is Data Pipeline? A Detailed Explanation

Smart Data Collective

The final point to which the data has to be eventually transferred is a destination. The destination is decided by the use case of the data pipeline. It can be used to run analytical tools and power data visualization as well. Otherwise, it can also be moved to a storage centre like a data warehouse or lake.

article thumbnail

A Guide to Choose the Best Data Science Bootcamp

Data Science Dojo

Data science bootcamps are intensive short-term educational programs designed to equip individuals with the skills needed to enter or advance in the field of data science. They cover a wide range of topics, ranging from Python, R, and statistics to machine learning and data visualization.

professionals

Sign Up for our Newsletter

This site is protected by reCAPTCHA and the Google Privacy Policy and Terms of Service apply.

Trending Sources

article thumbnail

The project I did to land my business intelligence internship?—?CAR BRAND SEARCH

Mlearning.ai

The project I did to land my business intelligence internship — CAR BRAND SEARCH ETL PROCESS WITH PYTHON, POSTGRESQL & POWER BI 1. Section 2: Explanation of the ETL diagram for the project. Section 4: Reporting data for the project insights. ETL ARCHITECTURE DIAGRAM ETL stands for Extract, Transform, Load.

article thumbnail

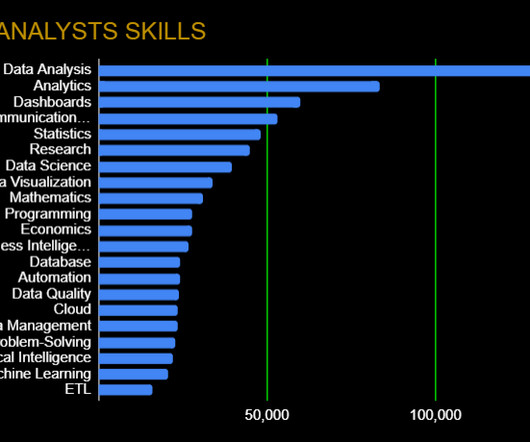
Top Data Analytics Skills and Platforms for 2023

ODSC - Open Data Science

As you’ll see below, however, a growing number of data analytics platforms, skills, and frameworks have altered the traditional view of what a data analyst is. Data Presentation: Communication Skills, Data Visualization Any good data analyst can go beyond just number crunching.

article thumbnail

Optimizing Custom SQL for Tableau

phData

database permissions, ETL capability, processing, etc.), In this blog, we will cover effective strategies for optimizing Custom SQL queries in Tableau to enhance your performance and streamline data visualization. These strategies will range from ways to reduce the size of your data, to your query structure.

Tableau 52
article thumbnail

Importing Data in Python Cheat Sheet with Comprehensive Tutorial

Pickl AI

Here we will upskill you with the Pandas library which stands as a highly favored asset amongst data scientists, facilitating seamless data manipulation and analysis. Alongside Matplotlib, a key tool for data visualization, and NumPy, the foundational library for scientific computing upon which Pandas was constructed.

Python 52