This site uses cookies to improve your experience. To help us insure we adhere to various privacy regulations, please select your country/region of residence. If you do not select a country, we will assume you are from the United States. Select your Cookie Settings or view our Privacy Policy and Terms of Use.
Cookie Settings
Cookies and similar technologies are used on this website for proper function of the website, for tracking performance analytics and for marketing purposes. We and some of our third-party providers may use cookie data for various purposes. Please review the cookie settings below and choose your preference.
Used for the proper function of the website
Used for monitoring website traffic and interactions
Cookie Settings
Cookies and similar technologies are used on this website for proper function of the website, for tracking performance analytics and for marketing purposes. We and some of our third-party providers may use cookie data for various purposes. Please review the cookie settings below and choose your preference.
Strictly Necessary: Used for the proper function of the website
Performance/Analytics: Used for monitoring website traffic and interactions
Each aspect of data science, like data preparation, the importance of big data, and the process of automation, contributes to how data science is the future […] The post 30 Best Data Science Books to Read in 2023 appeared first on Analytics Vidhya.
Embark on a journey of infinite possibilities at DataHack Summit 2023, India’s premier AI conference. Join us in Bengaluru from August 02,2023 – August 05,2023 at […] The post AI Event of the Year: DataHack Summit 2023 appeared first on Analytics Vidhya.
In this blog, we will share the list of leading data science conferences across the world to be held in 2023. This will help you to learn and grow your career in data science, AI and machine learning. Top data science conferences 2023 in different regions of the world 1.
Both disciplines are revolutionizing how we process, analyze, and make sense of data to solve complex problems and make informed decisions. In this blog, we will delve into the definitions of Data Science and AI, explore […].
Data Analyst Data analysts are responsible for collecting, analyzing, and interpreting large sets of data to identify patterns and trends. They require strong analytical skills, knowledge of statistical analysis, and expertise in datavisualization.
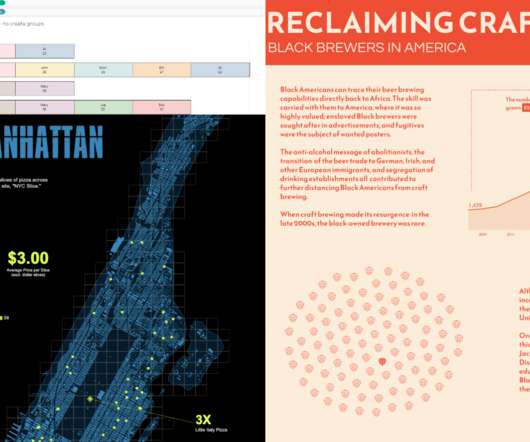
Data continues on its upwards trajectory and with it comes the importance of visualization. Many charts were made in 2023. If I liked something, it was on FlowingData. These are my ten favorites from the year. Read More
If yes, becoming a data strategist is your right career path. Imagine being the hero of an organization, armed with the ability to turn massive data sets into game-changing […] The post How to Become a Data Strategist in 2023? appeared first on Analytics Vidhya.
A crucial catalyst behind this transformation is the skill set of machine learning […] The post 10 Must Have Machine Learning Engineer Skills in 2023 appeared first on Analytics Vidhya.
Here are some of the things you can expect to learn in a data science bootcamp: Data science concepts : This includes topics such as statistics, machine learning, and datavisualization. Hands-on projects : You will have the opportunity to work on real-world data science projects.
So, let’s […] The post Data Scientist vs Data Analyst: Which is a Better Career Option to Pursue in 2023? But with so many job titles and buzzwords floating around, figuring out which path to pursue can be challenging. appeared first on Analytics Vidhya.
Everything we do is captured in the form of data. This data […] The post 5 Bad Reasons to Become a Data Scientist in 2023 appeared first on Analytics Vidhya. This is due to the increased use of digital devices for texting, sending images, and emails, doing transactions, searching queries online, and so on.
Top AI conferences and events around the world in 2023 Here are some of the top AI-related virtual events and conferences held around the world in 2023: 1. Generative AI and Data Storytelling (Virtual event | 27th September – 2023) A virtual event on generative AI and data storytelling. Click below 2.
As we move further into the age of data-driven decision-making, the role of the data analyst continues to evolve and expand. In 2023, data analysts will be expected to have a wide range of skills and knowledge to be effective in their roles. Programming Programming is a crucial skill for data analysts.
For example, a senior data scientist with a lot of experience will typically earn more than an entry-level data scientist. Data Scientist Salaries in 2023Data Scientists Salaries To get a better understanding of data scientist salaries in 2023, a study analyzed data from Indeed.com.
Sam Epley Lead Solution Engineer, Tableau Sarah Molina September 1, 2023 - 3:33pm September 2, 2023 Hello college football fans! My journey into the world of datavisualization has led me to embrace a unique passion: college football. My journey has revolved around using data to explore these untold narratives.
While a formal education is a good starting point, there are certain skills essential for any data scientist to possess to be successful in this field. However, certain technical skills are considered essential for a data scientist to possess.
Data engineering tools offer a range of features and functionalities, including data integration, data transformation, data quality management, workflow orchestration, and datavisualization. Essential data engineering tools for 2023 Top 10 data engineering tools to watch out for in 2023 1.
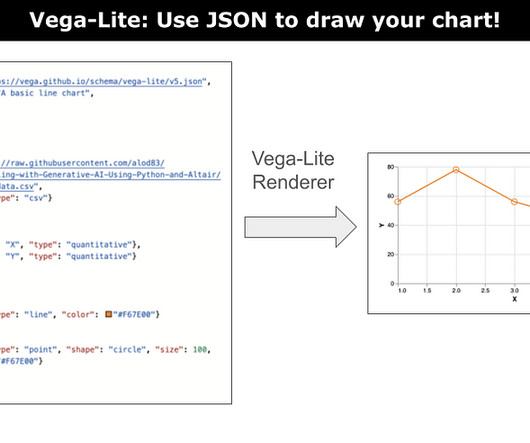
Last Updated on December 21, 2023 by Editorial Team Author(s): Angelica Lo Duca Originally published on Towards AI. A tutorial on how to start using Vega-Lite to draw charts.Image by Author Vega-lite is a concise JSON representation of a Vega visualization. For those who know D3.js, js, you can imagine the output produced by D3.js
Sam Epley Lead Solution Engineer, Tableau Sarah Molina September 1, 2023 - 3:33pm September 2, 2023 Hello college football fans! My journey into the world of datavisualization has led me to embrace a unique passion: college football. My journey has revolved around using data to explore these untold narratives.
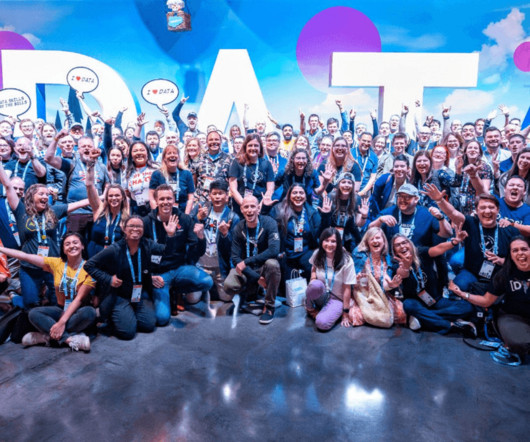
In March 2023, we had the pleasure of hosting the first edition of the Future of Data and AI conference – an incredible tech extravaganza that drew over 10,000 attendees, featured 30+ industry experts as speakers, and offered 20 engaging panels and tutorials led by the talented team at Data Science Dojo.
As we delve into 2023, the realms of Data Science, Artificial Intelligence (AI), and Large Language Models (LLMs) continue to evolve at an unprecedented pace. In this blog, we will explore the top 7 blogs of 2023 that have been instrumental in disseminating detailed and updated information in these dynamic fields.
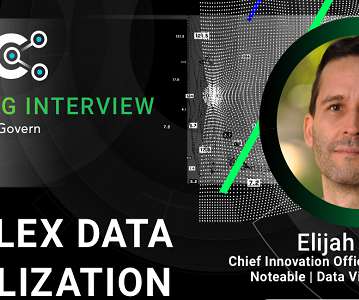
Recently, we spoke with Elijah Meeks, datavisualization expert and Chief Innovation Officer at Noteable about complex datavisualizations and their uses. What is complex datavisualization? I think that that’s one of the reasons why people are so nervous about leveraging complex datavisualization.
Ateken Abla Community Content Specialist Ateken Abla February 10, 2023 - 7:09am February 10, 2023 Welcome! Wells, a prominent journalist, activist, and researcher in the late 19th and early 20th centuries who pioneered data journalism. Data Superstar : Get ready for a datavisualization extravaganza!
Ateken Abla Community Content Specialist Ateken Abla February 10, 2023 - 7:09am February 10, 2023 Welcome! Wells, a prominent journalist, activist, and researcher in the late 19th and early 20th centuries who pioneered data journalism. Data Superstar : Get ready for a datavisualization extravaganza!
Sarah Molina February 10, 2023 - 8:42pm February 13, 2023 Win-loss margins, receiver routes, fan maps, game predictions—the list goes on for ways the game of American football can be visualized. See the curated collection below showcasing some incredible American football vizzes from the Tableau Community.
Sarah Molina February 10, 2023 - 8:42pm February 13, 2023 Win-loss margins, receiver routes, fan maps, game predictions—the list goes on for ways the game of American football can be visualized. See the curated collection below showcasing some incredible American football vizzes from the Tableau Community.
Last Updated on July 25, 2023 by Editorial Team Author(s): John Loewen, PhD Originally published on Towards AI. A case study example with UN population projection data The GPT-4 Python Code Interpreter, is turning heads in the world of data science for its ability to instantly generate datavisualization code AND display the results.
Introduction DreamFusion, the revolutionary AI-driven technology capable of converting text into 3D visuals using 2D diffusion techniques, has recently been honored with the prestigious Best Paper Award at ICLR-2023.
While machine learning frameworks and platforms like PyTorch, TensorFlow, and scikit-learn can perform data exploration well, it’s not their primary intent. There are also plenty of datavisualization libraries available that can handle exploration like Plotly, matplotlib, D3, Apache ECharts, Bokeh, etc.
ODSC East 2023 is still a bit over a month away, but we’re excited to be able to share our Preliminary Schedule with you! Day 0: Monday, May 8th Day 0 of ODSC East 2023 will be exclusive to Mini-Bootcamp and VIP pass holders, and will be a virtual-only day comprising the first bootcamp sessions of the week.
The role of a data scientist is in demand and 2023 will be no exception. To get a better grip on those changes we reviewed over 25,000 data scientist job descriptions from that past year to find out what employers are looking for in 2023. However, each year the skills and certainly the platforms change somewhat.
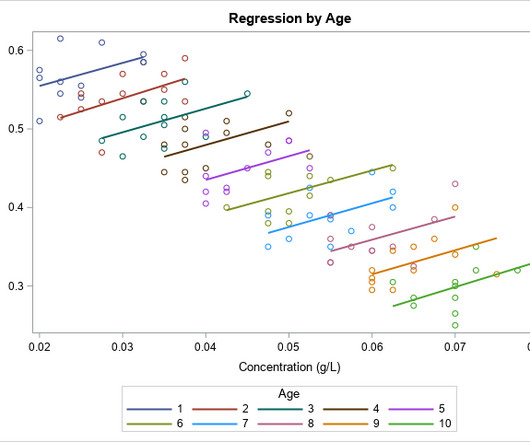
In 2023, I wrote 90 articles for The DO Loop blog. My most popular articles were about SAS programming, datavisualization, and statistics. The post Top 10 posts from <em>The DO Loop</em> in 2023 appeared first on SAS Blogs. If you missed any of these articles, [.]
Datavisualization tools turn insights and data into something understandable, especially for non-data stakeholders who may not share the same skillsets as the team who’s behind the data. So let’s take a look at seven trending datavisualization tools that have gotten quite a bit of attention on GitHub this year.
Britt Staniar Senior Community Program Manager, Recognition Programs Ateken Abla June 12, 2023 - 10:41pm June 14, 2023 Nominations and applications for the 2023 Tableau Ambassador Program are now open. Nominations will be open from June 14, 2023, through July 14, 2023, at 11:59 p.m. Ready to submit a name?
Last Updated on November 21, 2023 by Editorial Team Author(s): John Loewen, PhD Originally published on Towards AI. the Advanced Data Analysis tool) have been integrated into the main GPT-4 chat interface. Join thousands of data leaders on the AI newsletter.
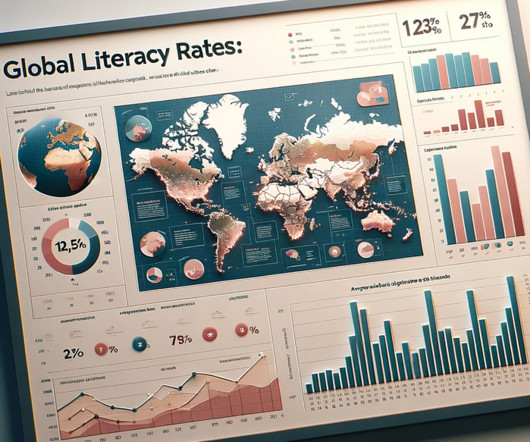
Last Updated on November 20, 2023 by Editorial Team Author(s): John Loewen, PhD Originally published on Towards AI. A zero-code map-and-charts dashboard for global literacy dataDall-E 2 generated choropleth map image Recently, GPT-4 has gone through a positive overhaul of its datavisualization capabilities.
Last Updated on September 27, 2023 by Editorial Team Author(s): RaviTeja G Originally published on Towards AI. Part 2: Exploring Exciting Features for Better Representation! World of charts — Image Generate with Ideogram.ai Welcome back to the second installment of our two-part series of Matplotlib.
GPT-4 no-code prompting for rapid datavisualization reporting As a computer science professor of 20+ years, I have oodles of experience in coding Python for datavisualizations. Until recently, the generation of beautiful datavisualizations has been the domain of folks like me — computer programmers and data analysts.
After the image has been submitted, the chatbot looks at it and adds the visual details to the dialogue. When GPT-4 was launched in March 2023, the term “multimodality” was used as a tease. Visual beauty: Learn how to improve your visual content with ChatGPT’s insights. Building with AI is getting wild.
Last Updated on July 4, 2023 by Editorial Team Author(s): John Loewen, PhD Originally published on Towards AI. Prompting GPT-4 to visualize global happiness data with Plotly This member-only story is on us. Effective, prompt engineering with AI can significantly speed up the Python coding process for complex datavisualizations.
Last Updated on August 29, 2023 by Editorial Team Author(s): Bex T. Image by me with Midjourney When I was a beginner learning datavisualization, I used to have a rule — never, ever visit the Matplotlib documentation. Originally published on Towards AI. Use Matplotlib like never before This member-only story is on us.
Countless hours vizzing, a standout Tableau Public profile , and a graduate degree later, Karolina reflects on her data journey and what led her to her current role as a Business Intelligence Analyst at Schneider Electric. I already had some interest in datavisualization, I just didn't know where to start.
Last Updated on September 23, 2023 by Editorial Team Author(s): RaviTeja G Originally published on Towards AI. Hello, Data Enthusiast? We know that data is better understood through visualizations. It doesn’t just help us get insights, Visualizations also make things easy to explain our insights to clients or others.
We organize all of the trending information in your field so you don't have to. Join 17,000+ users and stay up to date on the latest articles your peers are reading.
You know about us, now we want to get to know you!
Let's personalize your content
Let's get even more personalized
We recognize your account from another site in our network, please click 'Send Email' below to continue with verifying your account and setting a password.


Let's personalize your content