This site uses cookies to improve your experience. To help us insure we adhere to various privacy regulations, please select your country/region of residence. If you do not select a country, we will assume you are from the United States. Select your Cookie Settings or view our Privacy Policy and Terms of Use.
Cookie Settings
Cookies and similar technologies are used on this website for proper function of the website, for tracking performance analytics and for marketing purposes. We and some of our third-party providers may use cookie data for various purposes. Please review the cookie settings below and choose your preference.
Used for the proper function of the website
Used for monitoring website traffic and interactions
Cookie Settings
Cookies and similar technologies are used on this website for proper function of the website, for tracking performance analytics and for marketing purposes. We and some of our third-party providers may use cookie data for various purposes. Please review the cookie settings below and choose your preference.
Strictly Necessary: Used for the proper function of the website
Performance/Analytics: Used for monitoring website traffic and interactions
Summary: This PowerBI DAX tutorial introduces beginners to the fundamentals of Data Analysis Expressions, including syntax, functions, and context. It covers creating measures and calculated columns, using aggregate functions, and applying time intelligence for advanced Data Analysis. What is DAX?
Employing an analytical system in a data-driven business can help it to discover useful trends, information, conclusions and elevated decision making. PowerBI proves to be the best tool for analysis and visualization of data. Cloud-based PowerBI technology is a forerunner for corporate executives.
Data Mesh on Azure Cloud with Databricks and Delta Lake for Applications of Business Intelligence, Data Science and Process Mining. It offers robust IoT and edge computing capabilities, advanced data analytics, and AI services. The datamodels are seen as data products with defined value, costs and ownership.
Research Data Scientist Description : Research Data Scientists are responsible for creating and testing experimental models and algorithms. According to Google AI, they work on projects that may not have immediate commercial applications but push the boundaries of AI research.
In addition to Business Intelligence (BI), Process Mining is no longer a new phenomenon, but almost all larger companies are conducting this data-driven process analysis in their organization. This aspect can be applied well to Process Mining, hand in hand with BI and AI.
The Datamarts capability opens endless possibilities for organizations to achieve their data analytics goals on the PowerBI platform. Before we look into the PowerBI Datamarts, let us take a step back and understand the meaning of a Datamart. What is PowerBI Datamarts? What is a Datamart?
Summary: PowerBI is a business analytics tool transforming data into actionable insights. Key features include AI-powered analytics, extensive data connectivity, customisation options, and robust datamodelling. Key Takeaways It transforms raw data into actionable, interactive visualisations.
Summary: This blog dives into the most promising PowerBI projects, exploring advanced data visualization, AI integration, IoT & blockchain analytics, and emerging technologies. Discover best practices for successful implementation and propel your organization towards data-driven success.
Summary: PowerBI is a leading data analytics platform offering advanced features like real-time analytics and collaborative capabilities. Understanding its significance is vital for aspiring PowerBI developers. Mastering PowerBI can significantly enhance career prospects, given its prevalence in the industry.
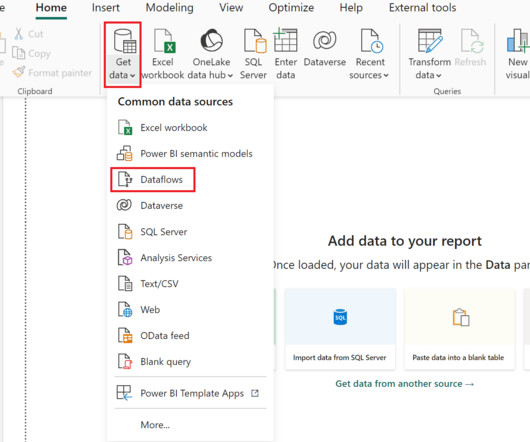
We at phData have written extensively about creating centralized data products in PowerBI. In this blog, we will explain dataflows and their use cases and show an example of how to bring data from Snowflake AIData Cloud into a dataflow. What are Dataflows, and Why are They So Great?
Summary: PowerBI alternatives like Tableau, Qlik Sense, and Zoho Analytics provide businesses with tailored Data Analysis and Visualisation solutions. Selecting the right alternative ensures efficient data-driven decision-making and aligns with your organisation’s goals and budget. What is PowerBI?
Summary: Counting rows is a fundamental task in PowerBI that requires careful consideration. This blog explores how to get total number of rows in power query. Understanding PowerBI and Its Importance PowerBI is a suite of business analytics tools that allows users to analyze data and share insights.
GPTs for Data science are the next step towards innovation in various data-related tasks. These are platforms that integrate the field of data analytics with artificial intelligence (AI) and machine learning (ML) solutions. What are GPTs for data science? This custom GPT is created by Open AI’s ChatGPT.
PowerBI Heatmap: Heatmap in PowerBI refers to the type of custom visualisation that businesses analysts utilise for showcasing the relationship between two variables on a map in different colour patches. It offers a wide range of features that make it a popular choice for data professionals, analysts, and organizations.
Tableau is particularly strong in industries like finance, healthcare, and retail where data-driven decisions are crucial. Real-Time Data Monitoring : Allows users to track metrics in real-time. Google Charts Google Charts is a free tool that provides a simple way to visualise data on the web.
Data science GPTs are the next step towards innovation in various data-related tasks. OpenAI’s GPT store is designed to make AI-powered solutions more accessible to different community members. However, our focus lies on exploring the data science GPTs available on the platform. What are data science GPTs?
GPTs for Data science are the next step towards innovation in various data-related tasks. These are platforms that integrate the field of data analytics with artificial intelligence (AI) and machine learning (ML) solutions. What are GPTs for data science? This custom GPT is created by Open AI’s ChatGPT.
There is a plethora of BI tools available in the market today, with new ones being added yearly. Through a comparative analysis of some of the leading BI tools: Google Looker, Microsoft PowerBI, Tableau and Qlik Sense, discover which BI solution best fits your organization’s data analytics needs to empower informed decision-making.
And that is why: with BI you rely on a broader range of data, get deeper insights into the market, have a better vision of your companies strengths and weaknesses, receive trustworthy forecasts on business trends and get data-backed actionable tips on developing your business. SAP Lumira.
Effective Techniques for Data Visualization Let’s dive into the world of PowerBI to explore its features and learn some useful data visualization tips and tricks for data visualization. One of the most potent features of PowerBI is Quick Insights.
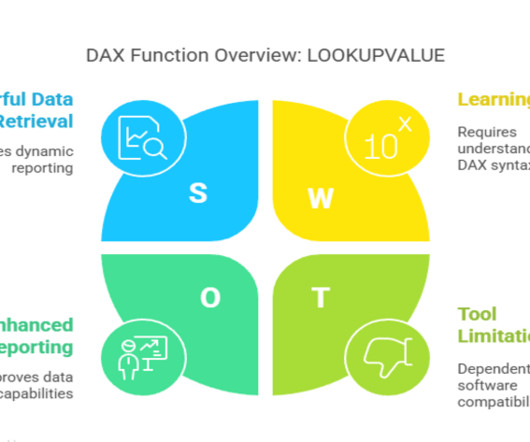
It helps retrieve values from tables based on specific conditions, making it a powerful tool for data analysis in PowerBI and Excel. By the end, you’ll have a solid grasp of how and when to leverage dax lookupvalue in your PowerBI reports or Excel Power Pivot models.
Overview: Data science vs data analytics Think of data science as the overarching umbrella that covers a wide range of tasks performed to find patterns in large datasets, structure data for use, train machine learning models and develop artificial intelligence (AI) applications.
Summary: Operations Analyst job in 2025 are integral to improving efficiency, data analysis, and process optimisation. Their roles now include using advanced technologies like AI and automation. With career growth opportunities and a focus on data-driven decisions, this job remains central to organisational success.
Though just about every industry imaginable utilizes the skills of a data-focused professional, each has its own challenges, needs, and desired outcomes. This is why you’ll often find that there are jobs in AI specific to an industry, or desired outcome when it comes to data.
It is the process of converting raw data into relevant and practical knowledge to help evaluate the performance of businesses, discover trends, and make well-informed choices. Data gathering, data integration, datamodelling, analysis of information, and data visualization are all part of intelligence for businesses.
Microsoft PowerBI Microsoft PowerBI integrates with various Microsoft products and offers robust reporting features. It is widely used by organizations such as Coca-Cola, which utilizes PowerBI to streamline its sales processes by analysing customer purchase trends and inventory levels.
Ensuring data accuracy and consistency through cleansing and validation processes. Data Analysis and Modelling Applying statistical techniques and analytical tools to identify trends, patterns, and anomalies. Developing datamodels to support analysis and reporting.
Some of the common career opportunities in BI include: Entry-level roles Data analyst: A data analyst is responsible for collecting and analyzing data, creating reports, and presenting insights to stakeholders. They may also be involved in datamodeling and database design.
Some of the common career opportunities in BI include: Entry-level roles Data analyst: A data analyst is responsible for collecting and analyzing data, creating reports, and presenting insights to stakeholders. They may also be involved in datamodeling and database design.
But its status as the go-between for programming and data professionals isn’t its only power. Within SQL you can also filter data, aggregate it and create valuations, manipulate data, update it, and even do datamodeling. One set of tools that are becoming more important in our data-driven world is BI tools.
They are useful for big data analytics where flexibility is needed. DataModelingDatamodeling involves creating logical structures that define how data elements relate to each other. This includes: Dimensional Modeling : Organizes data into dimensions (e.g., time, product) and facts (e.g.,
Tableau is an interactive platform that enables users to analyse and visualise data to gain insights. For instance, the average Tableau Data Scientist salary as per PayScale stands a US$87, 577 compared to a Data Scientist with PowerBI skills which is US$62, 079.
Hierarchies align datamodelling with business processes, making it easier to analyse data in a context that reflects real-world operations. Designing Hierarchies Designing effective hierarchies requires careful consideration of the business requirements and the datamodel.
They must be capable of comprehending intricate data structures and have a solid grasp of SQL queries. Database creation and maintenance: SQL data analysts are responsible for creating and keeping up-to-date secure databases. To find correlations and causes, they must be able to employ statistical tools and data analysis procedures.
Skills and Tools of Data Engineers Data Engineering requires a unique set of skills, including: Database Management: SQL, NoSQL, NewSQL, etc. Data Warehousing: Amazon Redshift, Google BigQuery, etc. DataModeling: Entity-Relationship (ER) diagrams, data normalization, etc.
Perform data transformations, such as merging, filtering, and aggregating dataData Analysis and Modeling Analyze data using statistical techniques, data mining, and predictive modeling. With this course, you will learn about Python, Tableau, PowerBI, Matplolib and more.
These tools enable effective data structuring, transformation, and analysis, supporting best practices for dimensional modelling and ensuring high-quality, consistent business metrics. These tools are essential for populating fact tables with accurate and timely data.
MongoDB is a NoSQL database that uses a document-oriented datamodel. It stores data in flexible, JSON-like documents, allowing for dynamic schemas. Each document can have a different structure, allowing for flexibility in datamodelling. 2024’s top PowerBI interview questions simplified.
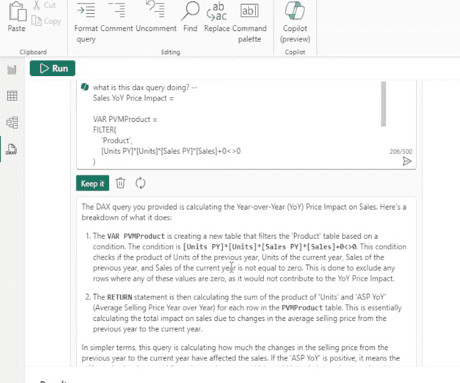
Among the various PowerBI tools available in the digital market to enable data-driven decision-making capabilities, PowerBI has emerged as a market leader. It uses generative AI throughout Microsofts tools to support development and decision-making. How Can Copilot Improve PowerBI Development?
Apache Hive Apache Hive is a data warehouse tool that allows users to query and analyse large datasets stored in Hadoop. It simplifies data processing by providing an SQL-like interface for querying Big Data. It integrates well with various data sources, making analysis easier.
We organize all of the trending information in your field so you don't have to. Join 17,000+ users and stay up to date on the latest articles your peers are reading.
You know about us, now we want to get to know you!
Let's personalize your content
Let's get even more personalized
We recognize your account from another site in our network, please click 'Send Email' below to continue with verifying your account and setting a password.


Let's personalize your content