This site uses cookies to improve your experience. To help us insure we adhere to various privacy regulations, please select your country/region of residence. If you do not select a country, we will assume you are from the United States. Select your Cookie Settings or view our Privacy Policy and Terms of Use.
Cookie Settings
Cookies and similar technologies are used on this website for proper function of the website, for tracking performance analytics and for marketing purposes. We and some of our third-party providers may use cookie data for various purposes. Please review the cookie settings below and choose your preference.
Used for the proper function of the website
Used for monitoring website traffic and interactions
Cookie Settings
Cookies and similar technologies are used on this website for proper function of the website, for tracking performance analytics and for marketing purposes. We and some of our third-party providers may use cookie data for various purposes. Please review the cookie settings below and choose your preference.
Strictly Necessary: Used for the proper function of the website
Performance/Analytics: Used for monitoring website traffic and interactions
According to Google AI, they work on projects that may not have immediate commercial applications but push the boundaries of AI research. With the continuous growth in AI, demand for remote data science jobs is set to rise. Specialists in this role help organizations ensure compliance with regulations and ethical standards.
Generative AI (GenAI) is stepping in to change the game by making data analytics accessible to everyone. As data keeps growing, tools powered by Generative AI for data analytics are helping businesses and individuals tap into this potential, making decisions faster and smarter.
Microsoft Fabric combines multiple elements into a single platform – Image courtesy of Microsoft The contribution of PowerBI The integration of Microsoft PowerBI and Microsoft Fabric offers a powerful combination for organizations seeking comprehensive data analytics and insights.
In March 2023, we had the pleasure of hosting the first edition of the Future of Data and AI conference – an incredible tech extravaganza that drew over 10,000 attendees, featured 30+ industry experts as speakers, and offered 20 engaging panels and tutorials led by the talented team at Data Science Dojo.
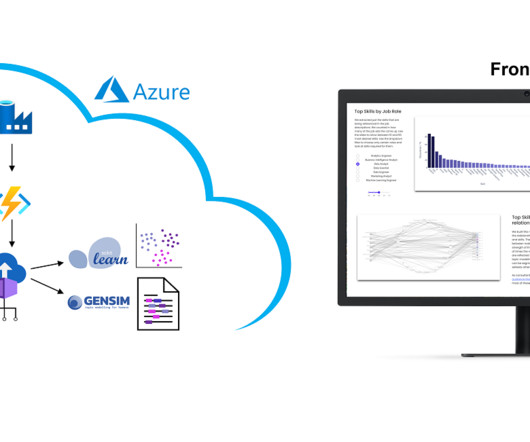
On own account, we from DATANOMIQ have created a web application that monitors data about job postings related to Data & AI from multiple sources (Indeed.com, Google Jobs, Stepstone.de The post Monitoring of Jobskills with Data Engineering & AI appeared first on Data Science Blog. Why we did it?
Summary : Microsoft Fabric is an end-to-end Data Analytics platform designed for integration, processing, and advanced insights, while PowerBI excels in creating interactive visualisations and reports. Key Takeaways Microsoft Fabric is a full-scale data platform, while PowerBI focuses on visualising insights.
Summary: PowerBI alternatives like Tableau, Qlik Sense, and Zoho Analytics provide businesses with tailored Data Analysis and Visualisation solutions. Introduction PowerBI has become one of the most popular business intelligence (BI) tools, offering powerful Data Visualisation, reporting, and decision-making features.
Summary: PowerBI is a business analytics tool transforming data into actionable insights. Key features include AI-powered analytics, extensive data connectivity, customisation options, and robust data modelling. It offers AI-driven analytics, including Natural Language Processing. Why PowerBI?
The Datamarts capability opens endless possibilities for organizations to achieve their data analytics goals on the PowerBI platform. Before we look into the PowerBI Datamarts, let us take a step back and understand the meaning of a Datamart. What is PowerBI Datamarts?
Summary: PowerBI is a business intelligence tool that transforms raw data into actionable insights. PowerBI enhances decision-making by providing interactive dashboards and reports that are accessible to both technical and non-technical users. What Is PowerBI?
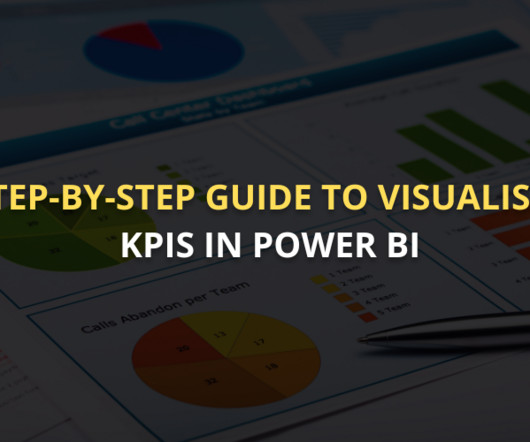
Summary: This guide covers visualising KPI in PowerBI, from setting up the tool and preparing data to selecting the right visuals and enhancing dashboards. PowerBI is an excellent tool for this purpose, offering powerful features to create interactive, dynamic visualisations that bring data to life.
Summary: PowerBI is a leading data analytics platform offering advanced features like real-time analytics and collaborative capabilities. Understanding its significance is vital for aspiring PowerBI developers. Mastering PowerBI can significantly enhance career prospects, given its prevalence in the industry.
Summary: Data Visualisation is crucial to ensure effective representation of insights tableau vs powerbi are two popular tools for this. This article compares Tableau and PowerBI, examining their features, pricing, and suitability for different organisations. What is PowerBI? billion in 2023.
Though both are great to learn, what gets left out of the conversation is a simple yet powerful programming language that everyone in the data science world can agree on, SQL. But why is SQL, or Structured Query Language , so important to learn? Let’s start with the first clause often learned by new SQL users, the WHERE clause.
PowerBI Heatmap: Heatmap in PowerBI refers to the type of custom visualisation that businesses analysts utilise for showcasing the relationship between two variables on a map in different colour patches. It helps the user in visualising the patterns which are hidden and observe the changes across each axis.
The processes of SQL, Python scripts, and web scraping libraries such as BeautifulSoup or Scrapy are used for carrying out the data collection. Visualization libraries available in Python such as Matplotlib and Seaborn, and tools like Tableau and PowerBI become crucial to telling stories that lead to insights.
Introduction The world is transforming by AI, ML, Blockchain, and Data Science drastically, and hence its community is growing rapidly. So, to provide our community with the knowledge they need to master these domains, Analytics Vidhya has launched its DataHour sessions.
Summary: Business Analytics focuses on interpreting historical data for strategic decisions, while Data Science emphasizes predictive modeling and AI. Dashboards, such as those built using Tableau or PowerBI , provide real-time visualizations that help track key performance indicators (KPIs).
In addition to Business Intelligence (BI), Process Mining is no longer a new phenomenon, but almost all larger companies are conducting this data-driven process analysis in their organization. This aspect can be applied well to Process Mining, hand in hand with BI and AI. Click to enlarge!
SQL or Structured Query Language has a significant role to play in conducting practical Data Analysis. That’s where SQL comes in, enabling data analysts to extract, manipulate and analyse data from multiple sources. That’s where SQL comes in, enabling data analysts to extract, manipulate and analyse data from multiple sources.
CBRE is unlocking the potential of artificial intelligence (AI) to realize value across the entire commercial real estate lifecycle—from guiding investment decisions to managing buildings. The opportunities to unlock value using AI in the commercial real estate lifecycle starts with data at scale.
Software like Microsoft Excel and SQL helps them manipulate and query data efficiently. They use data visualisation tools like Tableau and PowerBI to create compelling reports. Key Features: Hands-on Training: Covers real-world Data Analysis methodologies, SQL , Python, and visualisation.
Last Updated on April 2, 2024 by Editorial Team Author(s): Kamireddy Mahendra Originally published on Towards AI. In this process, I am going to use PowerBI and Excel. Let’s jump into data analysis with the help of visuals that I have created using PowerBI. and their total bill amount.
There is a plethora of BI tools available in the market today, with new ones being added yearly. Through a comparative analysis of some of the leading BI tools: Google Looker, Microsoft PowerBI, Tableau and Qlik Sense, discover which BI solution best fits your organization’s data analytics needs to empower informed decision-making.
Tools like Tableau, PowerBI, and Python libraries such as Matplotlib and Seaborn are commonly taught. Databases and SQL : Managing and querying relational databases using SQL, as well as working with NoSQL databases like MongoDB. R : Often used for statistical analysis and data visualization.
Here are some of the best data preprocessing tools of 2023: Microsoft PowerBI Tableau Trifacta Talend Toad Data Point Power Query Microsoft PowerBI Microsoft PowerBI is a comprehensive data preparation tool that allows users to create reports with multiple complex data sources.
Overview: Data science vs data analytics Think of data science as the overarching umbrella that covers a wide range of tasks performed to find patterns in large datasets, structure data for use, train machine learning models and develop artificial intelligence (AI) applications. Watsonx comprises of three powerful components: the watsonx.ai
Their roles now include using advanced technologies like AI and automation. Expertise in tools like PowerBI, SQL, and Python is crucial. AI and automation play a central role in the evolving role. Analysts leverage advanced platforms like PowerBI, Tableau, and Looker to create real-time, actionable insights.
Key skills include SQL, data visualization, and business acumen. This blog will comprehensively explore the world of BI, dissecting what it is, the multifaceted responsibilities of a BI Analyst, and how to embark on this rewarding career path. Essential skills include SQL, data visualization, and strong analytical abilities.
Popular tools like PowerBI, Tableau, and Google Data Studio offer unique features for Data Analysis. Common tools like Tableau, PowerBI, and Google Data Studio enable businesses to create dynamic visualisations that simplify complex datasets. These visual representations help users quickly identify trends and patterns.
Though SQL is decades old and is still the “go-to” when it comes to the management of unstructured data, it doesn’t mean that you should neglect your other skills. If you’re looking to make a career shift or to level up your career, then check out our free Ai+ Careers platform. So, let’s get started! Not Keep That Toolkit Up-To-Date!
This is why you’ll often find that there are jobs in AI specific to an industry, or desired outcome when it comes to data. So let’s go ahead and look at some titles for jobs in AI, and industries that are similar to data scientists, but produce specific services for their niche.
Data Analytics Platforms: Tableau, PowerBI, Looker, Alteryx, Google Analytics, SPSS, SAP, Pandas. The most common trend shouldn’t come as a surprise, as the most in-demand data analytics platforms revolve around reporting, such as Tableau, PowerBI, Looker, Alteryx, Google Analytics, SPSS, and SAP.
Here are steps you can follow to pursue a career as a BI Developer: Acquire a solid foundation in data and analytics: Start by building a strong understanding of data concepts, relational databases, SQL (Structured Query Language), and data modeling.
Summary: Explore a range of top AI and Machine Learning courses that cover fundamental to advanced concepts, offering hands-on projects and industry insights. Introduction Artificial Intelligence (AI) and Machine Learning are revolutionising industries by enabling smarter decision-making and automation.
You can also read about Top 10 Data Science Interview Questions and Answers 2024’s Top PowerBI Interview Questions Top DBMS Interview Questions: Basic Level These DBMS interview questions for freshers establish your foundational understanding of DBMS concepts: 1. What are the different types of joins in SQL? What is a DBMS?
There were several rooms for speaking sessions covering customer stories, dbt for practitioners, dbt for enterprises, deeper dives into announcements, AI, and much more. BI Tool Integration: A new dbt Semantic Layer connection to PowerBI is coming soon! dbt Copilot: Your AI assistant (currently in beta)!
With expertise in programming languages like Python , Java , SQL, and knowledge of big data technologies like Hadoop and Spark, data engineers optimize pipelines for data scientists and analysts to access valuable insights efficiently. Excel, Tableau, PowerBI, SQL Server, MySQL, Google Analytics, etc.
Summary: The future of Data Science is shaped by emerging trends such as advanced AI and Machine Learning, augmented analytics, and automated processes. Key Takeaways AI and Machine Learning will advance significantly, enhancing predictive capabilities across industries. Here are five key trends to watch.
Both roles require strong analytical skills, proficiency in SQL and other programming languages, and the ability to interpret data and provide insights. Data Analysis: Proficiency in data analysis tools and techniques such as SQL, Excel, and data visualisation tools (e.g., Tableau, PowerBI).
It covers essential topics such as SQL queries, data visualization, statistical analysis, machine learning concepts, and data manipulation techniques. Key Takeaways SQL Mastery: Understand SQL’s importance, join tables, and distinguish between SELECT and SELECT DISTINCT. How do you join tables in SQL?
Tableau supports a variety of data sources including Excel spreadsheets, CSV files, SQL databases, and cloud-based platforms like Google BigQuery and Amazon Redshift. What is Data Blending in PowerBI? When is blending used in tableau? Which join is used in Data Blending in Tableau?
Consequently, if your results, scores, etc are stored in an SQL Database, Tableau can be able to quickly visualise easily your model metrics. With SQL queries Tableau helps in integrating with them effectively. Accordingly, Tableau Data Scientist salary is generally more than those experts having specialisation in PowerBI.
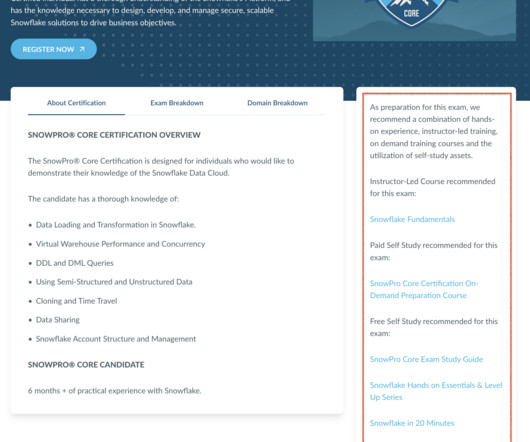
The SnowPro Advanced Data Scientist Certification is a test targeted at Data Scientists and AI/ML Engineers to appraise knowledge and skills used in the application of data science principles, tools, and methodologies using Snowflake. How Many Days Will It Take to Learn Snowflake?
We organize all of the trending information in your field so you don't have to. Join 17,000+ users and stay up to date on the latest articles your peers are reading.
You know about us, now we want to get to know you!
Let's personalize your content
Let's get even more personalized
We recognize your account from another site in our network, please click 'Send Email' below to continue with verifying your account and setting a password.


Let's personalize your content