This site uses cookies to improve your experience. To help us insure we adhere to various privacy regulations, please select your country/region of residence. If you do not select a country, we will assume you are from the United States. Select your Cookie Settings or view our Privacy Policy and Terms of Use.
Cookie Settings
Cookies and similar technologies are used on this website for proper function of the website, for tracking performance analytics and for marketing purposes. We and some of our third-party providers may use cookie data for various purposes. Please review the cookie settings below and choose your preference.
Used for the proper function of the website
Used for monitoring website traffic and interactions
Cookie Settings
Cookies and similar technologies are used on this website for proper function of the website, for tracking performance analytics and for marketing purposes. We and some of our third-party providers may use cookie data for various purposes. Please review the cookie settings below and choose your preference.
Strictly Necessary: Used for the proper function of the website
Performance/Analytics: Used for monitoring website traffic and interactions
They work at the intersection of various technical domains, requiring a blend of skills to handle data processing, algorithm development, system design, and implementation. Machine Learning Algorithms Recent improvements in machine learning algorithms have significantly enhanced their efficiency and accuracy.
Programming languages like Python and R are commonly used for data manipulation, visualization, and statistical modeling. Machine learning algorithms play a central role in building predictive models and enabling systems to learn from data. Data Science, however, uses predictive and prescriptive solutions.
A good course to upskill in this area is — Machine Learning Specialization DataVisualization The ability to effectively communicate insights through datavisualization is important. Check out this course to upskill on Apache Spark — [link] Cloud Computing technologies such as AWS, GCP, Azure will also be a plus.
It is popular for its powerful datavisualization and analysis capabilities. Hence, Data Scientists rely on R to perform complex statistical operations. With a wide array of packages like ggplot2 and dplyr, R allows for sophisticated datavisualization and efficient data manipulation. Wrapping it up !!!
Proficient in programming languages like Python or R, data manipulation libraries like Pandas, and machine learning frameworks like TensorFlow and Scikit-learn, data scientists uncover patterns and trends through statistical analysis and datavisualization. DataVisualization: Matplotlib, Seaborn, Tableau, etc.
Packages like stats, car, and survival are commonly used for statistical modeling and analysis. · DataVisualization : R offers several libraries, including ggplot2, plotly, and lattice, that allow for the creation of high-quality visualizations. This tool may mimic difficult regression as well as classification issues.
Descriptive Analytics Projects: These projects focus on summarizing historical data to gain insights into past trends and patterns. Examples include generating reports, dashboards, and datavisualizations to understand business performance, customer behavior, or operational efficiency.
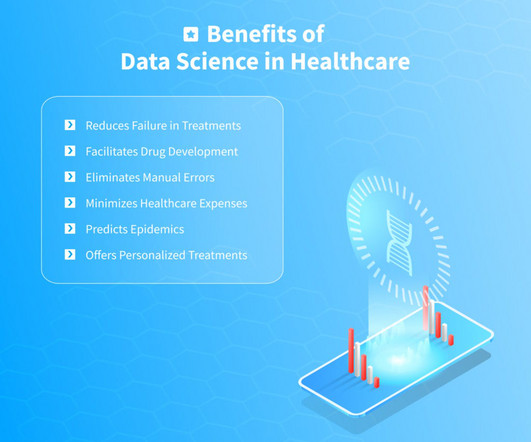
However, using existing historical data and studies allows a healthcare data scientist to accelerate the research. The implementation of machine learning algorithms enables the prediction of drug performance and side effects. Such programs detect even microscopic abnormalities through image segmentation.
We organize all of the trending information in your field so you don't have to. Join 17,000+ users and stay up to date on the latest articles your peers are reading.
You know about us, now we want to get to know you!
Let's personalize your content
Let's get even more personalized
We recognize your account from another site in our network, please click 'Send Email' below to continue with verifying your account and setting a password.


Let's personalize your content