This site uses cookies to improve your experience. To help us insure we adhere to various privacy regulations, please select your country/region of residence. If you do not select a country, we will assume you are from the United States. Select your Cookie Settings or view our Privacy Policy and Terms of Use.
Cookie Settings
Cookies and similar technologies are used on this website for proper function of the website, for tracking performance analytics and for marketing purposes. We and some of our third-party providers may use cookie data for various purposes. Please review the cookie settings below and choose your preference.
Used for the proper function of the website
Used for monitoring website traffic and interactions
Cookie Settings
Cookies and similar technologies are used on this website for proper function of the website, for tracking performance analytics and for marketing purposes. We and some of our third-party providers may use cookie data for various purposes. Please review the cookie settings below and choose your preference.
Strictly Necessary: Used for the proper function of the website
Performance/Analytics: Used for monitoring website traffic and interactions
To address this challenge, businesses need to use advanced dataanalysis methods. These methods can help businesses to make sense of their data and to identify trends and patterns that would otherwise be invisible. In recent years, there has been a growing interest in the use of artificial intelligence (AI) for dataanalysis.
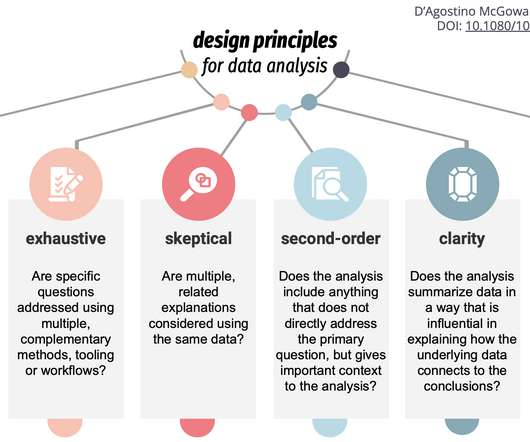
Hicks explain their work in the Journal of Computational and Graphical Statistics : The design principles for dataanalysis are qualities or characteristics that are relevant to the analysis and can be observed or measured. Tags: analysis , principle.
Summary: Big Datavisualization involves representing large datasets graphically to reveal patterns, trends, and insights that are not easily discernible from raw data. quintillion bytes of data daily, the need for effective visualization techniques has never been greater. As we generate approximately 2.5
For instance, Berkeley’s Division of Data Science and Information points out that entry level data science jobs remote in healthcare involves skills in NLP (Natural Language Processing) for patient and genomic dataanalysis, whereas remote data science jobs in finance leans more on skills in risk modeling and quantitative analysis.
That’s akin to the experience of sifting through today’s digital news landscape, except instead of a magical test, we have the power of dataanalysis to help us find the news that matters most to us. What if you could take a test that magically guides you to the knowledge that interests you most?
Read a comprehensive SQL guide for dataanalysis; Learn how to choose the right clustering algorithm for your data; Find out how to create a viral DataViz using the data from Data Science Skills poll; Enroll in any of 10 Free Top Notch Natural Language Processing Courses; and more.
Libraries and Tools: Libraries like Pandas, NumPy, Scikit-learn, Matplotlib, Seaborn, and Tableau are like specialized tools for dataanalysis, visualization, and machine learning. Data Cleaning and Preprocessing Before analyzing data, it often needs a cleanup. It’s like deciphering a secret code.
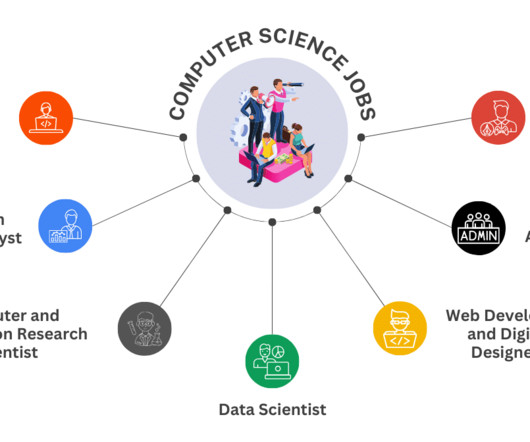
Data Analyst Data analysts are responsible for collecting, analyzing, and interpreting large sets of data to identify patterns and trends. They require strong analytical skills, knowledge of statistical analysis, and expertise in datavisualization.
The Power of Embeddings with Vector Search Embeddings are a powerful tool for representing data in an easy-to-understand way for machine learning algorithms. Master ChatGPT for DataAnalysis and Visualization! What are some of the benefits of using the ChatGPT API to build AI applications?
Phases of pattern recognition Exploratory phase: In this initial stage, data scientists investigate the dataset to uncover patterns without predefined criteria. Descriptive phase: Algorithms categorize and label the identified patterns, facilitating deeper analysis and understanding.
Data Science is a field that encompasses various disciplines, including statistics, machine learning, and dataanalysis techniques to extract valuable insights and knowledge from data. It is divided into three primary areas: data preparation, data modeling, and datavisualization.
Using the DirectX analytics interface can enable you to pick out important trading insights and points, which simplifies algorithmic trading. For example, when your trading algorithm makes losses or a particular threshold or condition is met. Helps in the design of simple geometric shapes for visualdataanalysis.
Summary: DataAnalysis focuses on extracting meaningful insights from raw data using statistical and analytical methods, while datavisualization transforms these insights into visual formats like graphs and charts for better comprehension. Is DataAnalysis just about crunching numbers?
It’s like the detective’s toolkit, providing the tools to analyze and interpret data. Think of it as the ability to read between the lines of the data and uncover hidden patterns. DataAnalysis and Interpretation: Data scientists use statistics to understand what the data is telling them.
Here are some key ways data scientists are leveraging AI tools and technologies: 6 Ways Data Scientists are Leveraging Large Language Models with Examples Advanced Machine Learning Algorithms: Data scientists are utilizing more advanced machine learning algorithms to derive valuable insights from complex and large datasets.
These skills include programming languages such as Python and R, statistics and probability, machine learning, datavisualization, and data modeling. Data preparation is an essential step in the data science workflow, and data scientists should be familiar with various data preparation tools and best practices.
Data Science is a multidisciplinary field that uses scientific methods, processes, algorithms, and systems to […] The post Top Data Science Specializations for 2024 appeared first on Analytics Vidhya. And why should one consider specializing in it? This blog post aims to answer these questions and more.
In addition to its prowess in crafting captivating narratives and artistic creations, generative AI demonstrates its versatility by helping users empower their own data analytics. With its advanced algorithms and language comprehension, it can navigate complex datasets and distill valuable insights.
It involves data collection, cleaning, analysis, and interpretation to uncover patterns, trends, and correlations that can drive decision-making. Their expertise lies in designing algorithms, optimizing models, and integrating them into real-world applications.
There are many well-known libraries and platforms for dataanalysis such as Pandas and Tableau, in addition to analytical databases like ClickHouse, MariaDB, Apache Druid, Apache Pinot, Google BigQuery, Amazon RedShift, etc. Datavisualization can help here by visualizing your datasets.
It’s an integral part of data analytics and plays a crucial role in data science. By utilizing algorithms and statistical models, data mining transforms raw data into actionable insights. Each stage is crucial for deriving meaningful insights from data.
Augmented analytics is revolutionizing how organizations interact with their data. By harnessing the power of machine learning (ML) and natural language processing (NLP), businesses can streamline their dataanalysis processes and make more informed decisions.
Their work involves designing experiments to test computing theories, developing new computing languages, and creating algorithms to improve software and hardware performance. Mathematical Aptitude: Proficiency in advanced mathematics, including calculus and discrete mathematics, which are essential for developing algorithms and models.
It provides a range of algorithms for classification, regression, clustering, and more. Seaborn: A Python datavisualization library based on matplotlib. It provides a range of statistical graphics and visualization tools. It is used extensively in scientific computing and dataanalysis.
They work at the intersection of various technical domains, requiring a blend of skills to handle data processing, algorithm development, system design, and implementation. Machine Learning Algorithms Recent improvements in machine learning algorithms have significantly enhanced their efficiency and accuracy.
Summary: Datavisualization is the art of transforming complex data sets into easily understandable visuals like charts, graphs, and maps. By presenting information visually, datavisualization allows us to communicate insights clearly and effectively to a wider audience.
Summary: The Data Science and DataAnalysis life cycles are systematic processes crucial for uncovering insights from raw data. Quality data is foundational for accurate analysis, ensuring businesses stay competitive in the digital landscape. billion INR by 2026, with a CAGR of 27.7%.
It could explain how these distributions are used in different machine learning algorithms and why understanding them is crucial for data scientists. 32 datasets to uplift your skills in data science Data Science Dojo has created an archive of 32 data sets for you to use to practice and improve your skills as a data scientist.
Open source business intelligence software is a game-changer in the world of dataanalysis and decision-making. It has revolutionized the way businesses approach data analytics by providing cost-effective and customizable solutions that are tailored to specific business needs.
In this blog post, Ill show how effective log datavisualization improves your enterprise observability workflows. Youll see how KronoGraph, our timeline visualization SDK , can work alongside your log table, or replace it entirely. With KronoGraph log datavisualization, observing log sources becomes instantaneous.
It is a robust and powerful statistical software designed to help make data-driven decisions across different fields such as social science, policy-making, healthcare research and more. However, by strategically combining these tools, they can unlock powerful synergies for data manipulation, visualization and complex dataanalysis methods.
The final point to which the data has to be eventually transferred is a destination. The destination is decided by the use case of the data pipeline. It can be used to run analytical tools and power datavisualization as well. Otherwise, it can also be moved to a storage centre like a data warehouse or lake.
Just as a writer needs to know core skills like sentence structure, grammar, and so on, data scientists at all levels should know core data science skills like programming, computer science, algorithms, and so on. This will lead to algorithm development for any machine or deep learning processes.
Some of the applications of data science are driverless cars, gaming AI, movie recommendations, and shopping recommendations. Since the field covers such a vast array of services, data scientists can find a ton of great opportunities in their field. Data scientists use algorithms for creating data models.
Datavisualization: DataVisualization in Python is a project that introduces users to techniques for visually representing data sets. With the help of Python’s data manipulation and visualization libraries, learners can create informative and visually appealing charts, graphs, and plots.
Experts from the field gathered to discuss and deliberate on various topics related to data and AI, sharing their insights with the attendees. Introduction to Python for Data Science: This lecture introduces the tools and libraries used in Python for data science and engineering. Want to dive deep into Python?
Python machine learning packages have emerged as the go-to choice for implementing and working with machine learning algorithms. These libraries, with their rich functionalities and comprehensive toolsets, have become the backbone of data science and machine learning practices. Why do you need Python machine learning packages?
Data science bootcamps are intensive short-term educational programs designed to equip individuals with the skills needed to enter or advance in the field of data science. They cover a wide range of topics, ranging from Python, R, and statistics to machine learning and datavisualization.
During the session, you’ll explore the theory and the pros and cons of various techniques for optimizing hyperparameters, including grid search, random search, Bayesian optimization, and evolutionary algorithms. Sign up here Above are just a few of the training sessions you’ll find at ODSC East. Keep your eyes peeled for more coming soon.
They design, develop, and deploy the machine learning algorithms that power everything from self-driving cars to personalized recommendations. In the context of a business, machine learning engineers are responsible for creating bots that are utilized for chat purposes or data collection. They build the future.
It could explain how these distributions are used in different machine learning algorithms and why understanding them is crucial for data scientists. The data sets are categorized according to varying difficulty levels to be suitable for everyone.
We decided to cover some of the most important differences between Data Mining vs Data Science in order to finally understand which is which. What is Data Science? Data Science is an activity that focuses on dataanalysis and finding the best solutions based on it. It hosts a dataanalysis competition.
Data scientists are the master keyholders, unlocking this portal to reveal the mysteries within. They wield algorithms like ancient incantations, summoning patterns from the chaos and crafting narratives from raw numbers. Model development : Crafting magic from algorithms!
Introduction to Deep Learning Algorithms: Deep learning algorithms are a subset of machine learning techniques that are designed to automatically learn and represent data in multiple layers of abstraction. This process is known as training, and it relies on large amounts of labeled data. How Deep Learning Algorithms Work?
We organize all of the trending information in your field so you don't have to. Join 17,000+ users and stay up to date on the latest articles your peers are reading.
You know about us, now we want to get to know you!
Let's personalize your content
Let's get even more personalized
We recognize your account from another site in our network, please click 'Send Email' below to continue with verifying your account and setting a password.


Let's personalize your content