This site uses cookies to improve your experience. To help us insure we adhere to various privacy regulations, please select your country/region of residence. If you do not select a country, we will assume you are from the United States. Select your Cookie Settings or view our Privacy Policy and Terms of Use.
Cookie Settings
Cookies and similar technologies are used on this website for proper function of the website, for tracking performance analytics and for marketing purposes. We and some of our third-party providers may use cookie data for various purposes. Please review the cookie settings below and choose your preference.
Used for the proper function of the website
Used for monitoring website traffic and interactions
Cookie Settings
Cookies and similar technologies are used on this website for proper function of the website, for tracking performance analytics and for marketing purposes. We and some of our third-party providers may use cookie data for various purposes. Please review the cookie settings below and choose your preference.
Strictly Necessary: Used for the proper function of the website
Performance/Analytics: Used for monitoring website traffic and interactions
Overview Machine Learning algorithms for classification involve learning how to assign classes to observations. There are nuances to every algorithm. Each algorithm differs in. The post Plotting Decision Surface for Classification Machine Learning Algorithms appeared first on Analytics Vidhya.
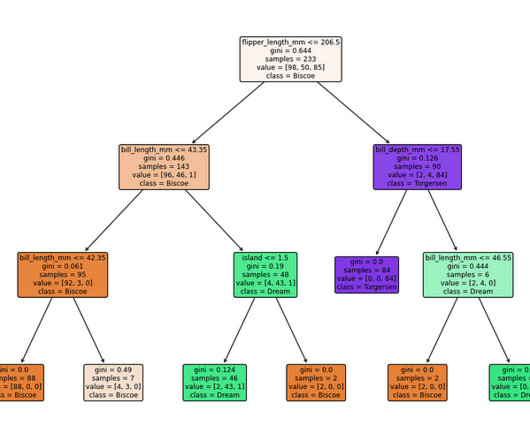
Fall in Love with DecisionTrees with dtreeviz’s Visualization This member-only story is on us. DecisionTrees, also known as CART (Classification and Regression Trees), are undoubtedly one of the most intuitive algorithms in the machine learning space, thanks to their simplicity.
Algorithms: Decisiontrees, random forests, logistic regression, and more are like different techniques a detective might use to solve a case. DataVisualization Think of datavisualization as creating a visual map of the data.
Data mining refers to the systematic process of analyzing large datasets to uncover hidden patterns and relationships that inform and address business challenges. It’s an integral part of data analytics and plays a crucial role in data science. This approach is useful for predicting outcomes based on historical data.
Algorithms: Decisiontrees, random forests, logistic regression, and more are like different techniques a detective might use to solve a case. DataVisualization Think of datavisualization as creating a visual map of the data.
Applied Data Science However, Applied Data Science, a subset of Data Science, offers a more practical and industry-specific approach. But what are the key concepts and methodologies involved in Applied Data Science? Machine learning algorithms Machine learning forms the core of Applied Data Science.
Hopefully, this article will serve as a roadmap for leveraging the power of R, a versatile programming language, for spatial analysis, data science and visualization within GIS contexts. Numerous spatial data formats, including shapefiles, GeoJSON, GeoTIFF, and NetCDF, can be read and written by these programs.
Introduction to Random Forest What’s the first image that comes to your mind when you think about Random Forest? It conjures up images of. The post A Beginner’s Guide to Random Forest Hyperparameter Tuning appeared first on Analytics Vidhya.
Summary: Data Analysis focuses on extracting meaningful insights from raw data using statistical and analytical methods, while datavisualization transforms these insights into visual formats like graphs and charts for better comprehension. Deep Dive: What is DataVisualization?
Concepts such as linear algebra, calculus, probability, and statistical theory are the backbone of many data science algorithms and techniques. Programming skills A proficient data scientist should have strong programming skills, typically in Python or R, which are the most commonly used languages in the field.
Each type and sub-type of ML algorithm has unique benefits and capabilities that teams can leverage for different tasks. Instead of using explicit instructions for performance optimization, ML models rely on algorithms and statistical models that deploy tasks based on data patterns and inferences. What is machine learning?
By scrutinizing data packets that constitute network traffic, NTA aims to establish baselines of normal behavior, detect deviations, and take appropriate actions. From data collection to establishing a baseline, to identifying errors and anomalies in the data, experts carefully examine the many steps that need to be carefully implemented.
Common machine learning algorithms for supervised learning include: K-nearest neighbor (KNN) algorithm : This algorithm is a density-based classifier or regression modeling tool used for anomaly detection. Regression modeling is a statistical tool used to find the relationship between labeled data and variable data.
Using sophisticated datavisualization tools, many of which are powered by AI, app analytics services empower businesses to better understand IT operations , helping teams make smarter decisions, faster. AI and ML algorithms enhance these features by processing unique app data more efficiently.
Aspiring Data Scientists must equip themselves with a diverse skill set encompassing technical expertise, analytical prowess, and domain knowledge. Whether you’re venturing into machine learning, predictive analytics, or datavisualization, honing the following top Data Science skills is essential for success.
Just as humans can learn through experience rather than merely following instructions, machines can learn by applying tools to data analysis. Machine learning works on a known problem with tools and techniques, creating algorithms that let a machine learn from data through experience and with minimal human intervention.
Cheat sheets for Data Scientists Cheat sheets are like treasure maps for Data Scientists, helping them navigate the vast sea of information and tools available to them. These reference guides condense complex concepts, algorithms, and commands into easy-to-understand formats.
Scikit-learn A machine learning powerhouse, Scikit-learn provides a vast collection of algorithms and tools, making it a go-to library for many data scientists. Matplotlib The main benefit of Matplotlib is its stunning visualizations. Programmers most frequently utilize Matplotlib for datavisualization projects.
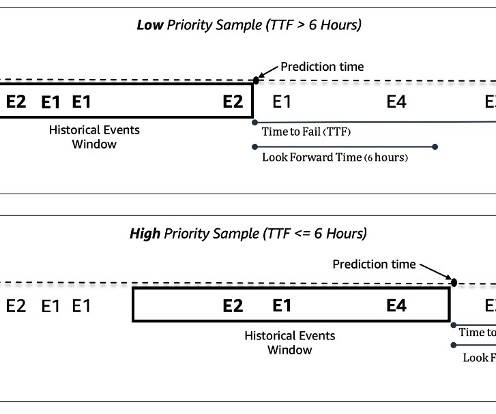
All the previously, recently, and currently collected data is used as input for time series forecasting where future trends, seasonal changes, irregularities, and such are elaborated based on complex math-driven algorithms. This results in quite efficient sales data predictions. In its core, lie gradient-boosted decisiontrees.
FREE: Managing fraud The ultimate guide to fraud detection, investigation and prevention using datavisualization GET YOUR FREE GUIDE The role of new & existing technology For many years, credit card companies have relied on analytics, algorithms and decisiontrees to power their fraud strategy.
It is popular for its powerful datavisualization and analysis capabilities. Hence, Data Scientists rely on R to perform complex statistical operations. With a wide array of packages like ggplot2 and dplyr, R allows for sophisticated datavisualization and efficient data manipulation. Wrapping it up !!!
Alteryx’s Capabilities Data Blending: Effortlessly combine data from multiple sources. Predictive Analytics: Leverage machine learning algorithms for accurate predictions. Reporting and Visualization: Craft interactive dashboards and reports seamlessly. Why is Alteryx better than Excel?
Just as a writer needs to know core skills like sentence structure and grammar, data scientists at all levels should know core data science skills like programming, computer science, algorithms, and soon. Core Machine Learning Algorithms Core machine learning algorithms remain foundational for data science workflows.
Read the full blog here — [link] Data Science Interview Questions for Freshers 1. What is Data Science? Once the exploratory steps are completed, the cleansed data is subjected to various algorithms like predictive analysis, regression, text mining, recognition patterns, etc depending on the requirements.
Big Data Big data refers to vast volumes of information that exceed the processing capabilities of traditional databases. Characterized by the three Vs: volume, velocity, and variety, big data poses unique challenges and opportunities. Data Analysis Data analysis is the heart of deriving insights from the gathered information.
The Current State of Data Science Data Science today is characterised by its integration with various technologies and methodologies that enhance its capabilities. The field has evolved significantly from traditional statistical analysis to include sophisticated Machine Learning algorithms and Big Data technologies.
It’s a cloud-based platform that provides datavisualization, collaboration tools, and advanced tracking and reporting ( Comet-ML , 2023). The platform’s goal is to make machine learning more accessible and efficient for researchers, data scientists, and machine learning practitioners. Read more about the package here. #To
Statistical Analysis Introducing statistical methods and techniques for analysing data, including hypothesis testing, regression analysis, and descriptive statistics. Students should gain a foundational understanding of statistics as it applies to data analytics. Students should learn how to apply machine learning models to Big Data.
You will collect and clean data from multiple sources, ensuring it is suitable for analysis. You will perform Exploratory Data Analysis to uncover patterns and insights hidden within the data. Visualising data makes it easier to identify anomalies and understand distributions.
Packages like stats, car, and survival are commonly used for statistical modeling and analysis. · DataVisualization : R offers several libraries, including ggplot2, plotly, and lattice, that allow for the creation of high-quality visualizations. This tool may mimic difficult regression as well as classification issues.
We used AutoGluon to explore several classic ML algorithms. AutoGluon is easy-to-use AutoML tool that uses automatic data processing, hyperparameter tuning, and model ensemble. The best baseline was achieved with a weighted ensemble of gradient boosted decisiontree models.
Here is the tabular representation of the same: Technical Skills Non-technical Skills Programming Languages: Python, SQL, R Good written and oral communication Data Analysis: Pandas, Matplotlib, Numpy, Seaborn Ability to work in a team ML Algorithms: Regression Classification, DecisionTrees, Regression Analysis Problem-solving capability Big Data: (..)
This comprehensive blog outlines vital aspects of Data Analyst interviews, offering insights into technical, behavioural, and industry-specific questions. It covers essential topics such as SQL queries, datavisualization, statistical analysis, machine learning concepts, and data manipulation techniques.
It’s also much more difficult to see how the intricate network of neurons processes the input data than to comprehend, say, a decisiontree. Data scientists and ML engineers: Creating and training deep learning models is no easy feat. All of these visualizations do not only satisfy curiosity.
It is a powerful tool that illuminates patterns, trends, and anomalies, enabling data scientists and stakeholders to make informed decisions. DataVisualization unveils data characteristics, distributions, and relationships, guiding feature engineering and preprocessing.
We organize all of the trending information in your field so you don't have to. Join 17,000+ users and stay up to date on the latest articles your peers are reading.
You know about us, now we want to get to know you!
Let's personalize your content
Let's get even more personalized
We recognize your account from another site in our network, please click 'Send Email' below to continue with verifying your account and setting a password.


Let's personalize your content