This site uses cookies to improve your experience. To help us insure we adhere to various privacy regulations, please select your country/region of residence. If you do not select a country, we will assume you are from the United States. Select your Cookie Settings or view our Privacy Policy and Terms of Use.
Cookie Settings
Cookies and similar technologies are used on this website for proper function of the website, for tracking performance analytics and for marketing purposes. We and some of our third-party providers may use cookie data for various purposes. Please review the cookie settings below and choose your preference.
Used for the proper function of the website
Used for monitoring website traffic and interactions
Cookie Settings
Cookies and similar technologies are used on this website for proper function of the website, for tracking performance analytics and for marketing purposes. We and some of our third-party providers may use cookie data for various purposes. Please review the cookie settings below and choose your preference.
Strictly Necessary: Used for the proper function of the website
Performance/Analytics: Used for monitoring website traffic and interactions
Summary: Big Datavisualization involves representing large datasets graphically to reveal patterns, trends, and insights that are not easily discernible from raw data. quintillion bytes of data daily, the need for effective visualization techniques has never been greater. As we generate approximately 2.5
Research Data Scientist Description : Research Data Scientists are responsible for creating and testing experimental models and algorithms. With the continuous growth in AI, demand for remote data science jobs is set to rise. Familiarity with machine learning, algorithms, and statistical modeling.
Python, R, and SQL: These are the most popular programming languages for data science. Libraries and Tools: Libraries like Pandas, NumPy, Scikit-learn, Matplotlib, Seaborn, and Tableau are like specialized tools for data analysis, visualization, and machine learning.
Guest author, Tableau DataDev Ambassador. Tableau is an innovator in the field of datavisualization with its ease of use, stunning visualizations, vibrant community, and more contributing to success. Visualization is, and I expect will always be, important to understand and help democratize data.
Guest author, Tableau DataDev Ambassador. Tableau is an innovator in the field of datavisualization with its ease of use, stunning visualizations, vibrant community, and more contributing to success. Visualization is, and I expect will always be, important to understand and help democratize data.
It has a wide range of machine 6: TableauTableau is a datavisualization software platform that can be used to create interactive dashboards and reports. It is a powerful tool that can be used to explore and understand data, and it can also be used to communicate insights to others.
Python, R, and SQL: These are the most popular programming languages for data science. Libraries and Tools: Libraries like Pandas, NumPy, Scikit-learn, Matplotlib, Seaborn, and Tableau are like specialized tools for data analysis, visualization, and machine learning.
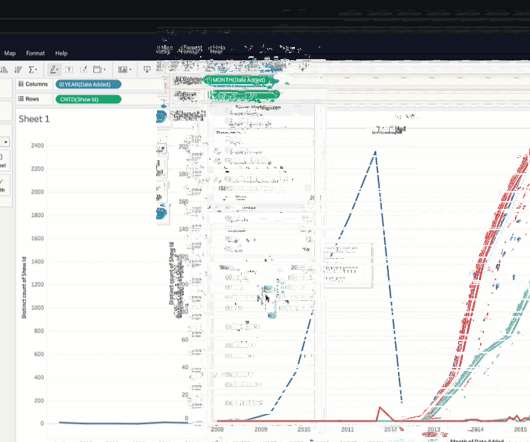
Editor's note: This article originally appeared in Tableau Public. When you want to explore, create, and share datavisualizations, we're happy to share that you can start creating vizzes directly from a browser on Tableau Public with the web authoring beta. If you don’t have a Tableau Public profile, create one for free.
These professionals are responsible for the design and development of AI systems, including machine learning algorithms, computer vision, natural language processing, and robotics. Introduction Artificial intelligence (AI) is one of the fastest-growing areas of technology, and AI engineers are at the forefront of this revolution.
It enhances traditional data analytics by allowing users to derive actionable insights quickly and efficiently. These algorithms continuously learn and improve, which helps in recognizing trends that may otherwise go unnoticed.
They work at the intersection of various technical domains, requiring a blend of skills to handle data processing, algorithm development, system design, and implementation. Machine Learning Algorithms Recent improvements in machine learning algorithms have significantly enhanced their efficiency and accuracy.
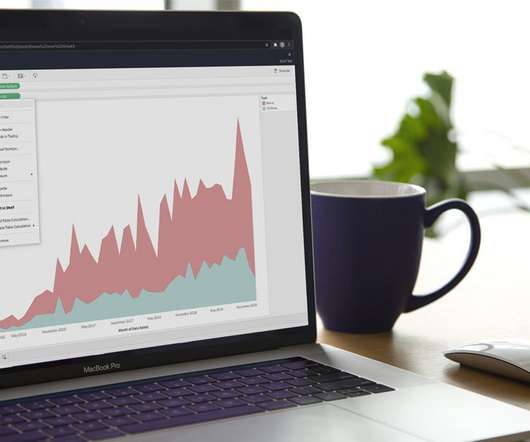
Summary: Datavisualization is the art of transforming complex data sets into easily understandable visuals like charts, graphs, and maps. By presenting information visually, datavisualization allows us to communicate insights clearly and effectively to a wider audience.
There are many well-known libraries and platforms for data analysis such as Pandas and Tableau, in addition to analytical databases like ClickHouse, MariaDB, Apache Druid, Apache Pinot, Google BigQuery, Amazon RedShift, etc. Datavisualization can help here by visualizing your datasets.
Summary: Data Analysis focuses on extracting meaningful insights from raw data using statistical and analytical methods, while datavisualization transforms these insights into visual formats like graphs and charts for better comprehension. Deep Dive: What is DataVisualization?
Summary: Struggling to translate data into clear stories? Tableau can help! This datavisualization tool empowers Data Analysts with drag-and-drop simplicity, interactive dashboards, and a wide range of visualizations. What are The Benefits of Learning Tableau for Data Analysts?
Concepts such as linear algebra, calculus, probability, and statistical theory are the backbone of many data science algorithms and techniques. Programming skills A proficient data scientist should have strong programming skills, typically in Python or R, which are the most commonly used languages in the field.
Key Tools and Techniques Business Analytics employs various tools and techniques to process and interpret data effectively. Dashboards, such as those built using Tableau or Power BI , provide real-time visualizations that help track key performance indicators (KPIs). Data Scientists require a robust technical foundation.
Here are some of the key features of open source BI software: Data integration: Open source BI software can pull data from various sources, such as databases, spreadsheets, and cloud services, and integrate it into a single location for analysis.
Editor's note: This article originally appeared in Tableau Public. When you want to explore, create, and share datavisualizations, we're happy to share that you can start creating vizzes directly from a browser on Tableau Public with the web authoring beta. If you don’t have a Tableau Public profile, create one for free.
One of the biggest benefits of Tableau is that the software is free and extremely versatile. It can connect any data source, although the better your source, the better the results will be. It can connect any data source, although the better your source, the better the results will be.
Data science bootcamps are intensive short-term educational programs designed to equip individuals with the skills needed to enter or advance in the field of data science. They cover a wide range of topics, ranging from Python, R, and statistics to machine learning and datavisualization.
Just as a writer needs to know core skills like sentence structure, grammar, and so on, data scientists at all levels should know core data science skills like programming, computer science, algorithms, and so on. This will lead to algorithm development for any machine or deep learning processes.
Over the past 11 years in the field of data science, I’ve witnessed significant transformations. The industry has evolved from relying on tools like SAS and R to placing a spotlight on datavisualization tools like Tableau and PowerBI.
The visualization of the data is important as it gives us hidden insights and potential details about the dataset and its pattern, which we may miss out on without datavisualization. These visualizations can be done using platforms like software tools (e.g., What are ETL and data pipelines?
Business users will also perform data analytics within business intelligence (BI) platforms for insight into current market conditions or probable decision-making outcomes. Many functions of data analytics—such as making predictions—are built on machine learning algorithms and models that are developed by data scientists.
In the digital age, the abundance of textual information available on the internet, particularly on platforms like Twitter, blogs, and e-commerce websites, has led to an exponential growth in unstructured data. Text data is often unstructured, making it challenging to directly apply machine learning algorithms for sentiment analysis.
Alteryx’s Capabilities Data Blending: Effortlessly combine data from multiple sources. Predictive Analytics: Leverage machine learning algorithms for accurate predictions. Reporting and Visualization: Craft interactive dashboards and reports seamlessly. Is Alteryx similar to Tableau?
Aspiring Data Scientists must equip themselves with a diverse skill set encompassing technical expertise, analytical prowess, and domain knowledge. Whether you’re venturing into machine learning, predictive analytics, or datavisualization, honing the following top Data Science skills is essential for success.
These tools enable organizations to convert raw data into actionable insights through various means such as reporting, analytics, datavisualization, and performance management. Data Processing: Cleaning and organizing data for analysis.
Machine Learning Engineer Machine Learning Engineers develop algorithms and models that enable machines to learn from data. Strong understanding of data preprocessing and algorithm development. Data Scientist Data Scientists analyze complex data sets to extract meaningful insights that inform business decisions.
It employs progressive alignment algorithms to identify conserved regions and sequence variations among a set of related sequences. Data Visualisation Data visualisation involves presenting complex data in a clear and understandable format. It is useful for visualising complex data and identifying patterns and trends.
Proficient in programming languages like Python or R, data manipulation libraries like Pandas, and machine learning frameworks like TensorFlow and Scikit-learn, data scientists uncover patterns and trends through statistical analysis and datavisualization. DataVisualization: Matplotlib, Seaborn, Tableau, etc.
In this article, let’s understand an explanation of how to enhance problem-solving skills as a data engineer. Understanding these fundamentals is essential for effective problem-solving in data engineering. Practice coding with the help of languages that are used in data engineering like Python, SQL, Scala, or Java.
It is the process of converting raw data into relevant and practical knowledge to help evaluate the performance of businesses, discover trends, and make well-informed choices. Data gathering, data integration, data modelling, analysis of information, and datavisualization are all part of intelligence for businesses.
The Current State of Data Science Data Science today is characterised by its integration with various technologies and methodologies that enhance its capabilities. The field has evolved significantly from traditional statistical analysis to include sophisticated Machine Learning algorithms and Big Data technologies.
Just as a writer needs to know core skills like sentence structure and grammar, data scientists at all levels should know core data science skills like programming, computer science, algorithms, and soon. Core Machine Learning Algorithms Core machine learning algorithms remain foundational for data science workflows.
As you’ll see below, however, a growing number of data analytics platforms, skills, and frameworks have altered the traditional view of what a data analyst is. Data Presentation: Communication Skills, DataVisualization Any good data analyst can go beyond just number crunching.
Summary: Leveraging data skills for Financial Analysts explores how Financial Analysts can harness data skills to enhance their roles. It delves into data analysis techniques to interpret financial trends effectively, including statistical analysis and datavisualization. appeared first on Pickl.AI.
Thus, it focuses on providing all the fundamental concepts of Data Science and light concepts of Machine Learning, Artificial Intelligence, programming languages and others. Usually, a Data Science course comprises topics on statistical analysis, datavisualization, data mining and data preprocessing.
This article throws light on the 10 best cities for Data Scientists offering the best Data Science salary in India. What is Data Science? Data science is an interdisciplinary field that combines scientific methods, algorithms, and systems to extract knowledge and insights from structured and unstructured data.
Statistical Analysis Introducing statistical methods and techniques for analysing data, including hypothesis testing, regression analysis, and descriptive statistics. Students should gain a foundational understanding of statistics as it applies to data analytics. Students should learn how to apply machine learning models to Big Data.
Data Cleaning is a crucial step in any data analysis process, and it’s important to showcase your ability to handle messy data effectively. DataVisualization: Create compelling and informative DataVisualizations. Visual Appeal: Use clean and visually appealing DataVisualizations.
Further, Data Scientists are also responsible for using machine learning algorithms to identify patterns and trends, make predictions, and solve business problems. Significantly, Data Science experts have a strong foundation in mathematics, statistics, and computer science.
Packages like stats, car, and survival are commonly used for statistical modeling and analysis. · DataVisualization : R offers several libraries, including ggplot2, plotly, and lattice, that allow for the creation of high-quality visualizations. You can simply drag and drop to complete your visualisation in minutes.
We organize all of the trending information in your field so you don't have to. Join 17,000+ users and stay up to date on the latest articles your peers are reading.
You know about us, now we want to get to know you!
Let's personalize your content
Let's get even more personalized
We recognize your account from another site in our network, please click 'Send Email' below to continue with verifying your account and setting a password.


Let's personalize your content