This site uses cookies to improve your experience. To help us insure we adhere to various privacy regulations, please select your country/region of residence. If you do not select a country, we will assume you are from the United States. Select your Cookie Settings or view our Privacy Policy and Terms of Use.
Cookie Settings
Cookies and similar technologies are used on this website for proper function of the website, for tracking performance analytics and for marketing purposes. We and some of our third-party providers may use cookie data for various purposes. Please review the cookie settings below and choose your preference.
Used for the proper function of the website
Used for monitoring website traffic and interactions
Cookie Settings
Cookies and similar technologies are used on this website for proper function of the website, for tracking performance analytics and for marketing purposes. We and some of our third-party providers may use cookie data for various purposes. Please review the cookie settings below and choose your preference.
Strictly Necessary: Used for the proper function of the website
Performance/Analytics: Used for monitoring website traffic and interactions
Primary Supervised Learning Algorithms Used in Machine Learning; Top 15 Books to Master Data Strategy; Top Data Science Podcasts for 2022; Prepare Your Data for Effective Tableau & PowerBI Dashboards; Generate Synthetic Time-series Data with Open-source Tools.
Research Data Scientist Description : Research Data Scientists are responsible for creating and testing experimental models and algorithms. Applied Machine Learning Scientist Description : Applied ML Scientists focus on translating algorithms into scalable, real-world applications.
Summary: This blog dives into the most promising PowerBI projects, exploring advanced data visualization, AI integration, IoT & blockchain analytics, and emerging technologies. Introduction to PowerBI Project s The world of Data Analysis is constantly evolving, and PowerBI stands at the forefront of this transformation.
IDP combines optical character recognition (OCR) technology with AI and ML algorithms to extract data and insights from documents, reducing the need for manual data […] The post Intelligent Document Processing with Azure Form Recognizer appeared first on Analytics Vidhya.
Getting your ML model ready for action: This stage involves building and training a machine learning model using efficient machine learning algorithms. This involves choosing the right machine-learning algorithm and tuning the model’s hyperparameters. This information can be used to inform the design of the model.
It provides a range of algorithms for classification, regression, clustering, and more. Link to the repository: [link] Looking to begin exploring, analyzing, and visualizing data with PowerBI Desktop? Our Introduction to PowerBI training course is designed to assist you in getting started!
These algorithms continuously learn and improve, which helps in recognizing trends that may otherwise go unnoticed. Automatic data identification Data extraction methods utilized by AI algorithms allow for the identification of relevant data from a multitude of sources.
Report generation: Open source BI software enables businesses to create customized reports that can be shared with team members and stakeholders to communicate insights and findings. The software also offers a suite of integrated tools, making it an all-in-one solution for data scientists and BI executives.
Dashboards, such as those built using Tableau or PowerBI , provide real-time visualizations that help track key performance indicators (KPIs). Machine learning algorithms play a central role in building predictive models and enabling systems to learn from data. ” and “what should be done?”
Decision intelligence is not just about crunching numbers or relying on algorithms; it is about unlocking the true potential of data to make smarter choices and fuel business success. Think of decision intelligence as a synergy between the human mind and cutting-edge algorithms. What is decision intelligence?
By visualising likes, shares, and comments over time, they can adjust their algorithms to enhance user experience and increase engagement. Use Cases Best suited for organisations already using Microsoft products, PowerBI is excellent for generating reports and dashboards that require real-time data analysis.
This unstructured nature poses challenges for direct analysis, as sentiments cannot be easily interpreted by traditional machine learning algorithms without proper preprocessing. Text data is often unstructured, making it challenging to directly apply machine learning algorithms for sentiment analysis.
Data Analysis and Modeling This stage is focused on discovering patterns, trends, and insights through statistical methods, machine-learning models, and algorithms. Visualization libraries available in Python such as Matplotlib and Seaborn, and tools like Tableau and PowerBI become crucial to telling stories that lead to insights.
For years, spreadsheet programs like Microsoft Excel, Google sheet, and more sophisticated programs like Microsoft PowerBI have been the primary tools for data analysis. Clustering can help you process large datasets and quickly organize them into something more usable with no need to define a full algorithm. Explainable AI.
Explore, analyze, and visualize data with our Introduction to PowerBI training & make data-driven decisions. 2. Pediatric Moonshot: This panel discussion will give an overview of the BevelCloud’s decentralized, in-the-building, edge cloud service, and its application to pediatric medicine.
A generative AI company exemplifies this by offering solutions that enable businesses to streamline operations, personalise customer experiences, and optimise workflows through advanced algorithms. Data forms the backbone of AI systems, feeding into the core input for machine learning algorithms to generate their predictions and insights.
Predictive analytics is the use of data and AI-poweredalgorithms to help analysts forecast the future and better predict business outcomes. Some major business intelligence platforms, like Microsoft’s PowerBI and Tableau , have already integrated NLP features — like semantic search.
Concepts such as linear algebra, calculus, probability, and statistical theory are the backbone of many data science algorithms and techniques. Coding skills are essential for tasks such as data cleaning, analysis, visualization, and implementing machine learning algorithms. This is where data visualization comes in.
Business users will also perform data analytics within business intelligence (BI) platforms for insight into current market conditions or probable decision-making outcomes. Many functions of data analytics—such as making predictions—are built on machine learning algorithms and models that are developed by data scientists.
And as the next step, the data is sent to such leading-edge BI tools, as Google Data Studio, PowerBI, Oracle BI, Tableau, etc., ML algorithms analyze dozens of metrics and connections between them and consequently stop fraudulent traffic. where data is visualized in multiple easy-to-understand graphs and reports.
This feature uses Machine Learning algorithms to detect patterns and anomalies, providing actionable insights without requiring complex formulas or manual analysis. Users can quickly identify key trends, outliers , and data relationships, making it easier to make informed decisions based on comprehensive, AI-powered analysis.
For instance, a Data Science team analysing terabytes of data can instantly provision additional processing power or storage as required, avoiding bottlenecks and delays. The cloud also offers distributed computing capabilities, enabling faster processing of complex algorithms across multiple nodes.
Popular tools like PowerBI, Tableau, and Google Data Studio offer unique features for Data Analysis. Common tools like Tableau, PowerBI, and Google Data Studio enable businesses to create dynamic visualisations that simplify complex datasets. These visual representations help users quickly identify trends and patterns.
Tools like Tableau, PowerBI, and Python libraries such as Matplotlib and Seaborn are commonly taught. Machine Learning : Supervised and unsupervised learning algorithms, including regression, classification, clustering, and deep learning. Tools and frameworks like Scikit-Learn, TensorFlow, and Keras are often covered.
It employs progressive alignment algorithms to identify conserved regions and sequence variations among a set of related sequences. PowerBIPowerBI is a business analytics tool that allows researchers to create interactive dashboards and reports. It is useful for storing and processing large datasets.
The primary functions of BI tools include: Data Collection: Gathering data from multiple sources including internal databases, external APIs, and cloud services. Data Analysis : Utilizing statistical methods and algorithms to identify trends and patterns. Data Processing: Cleaning and organizing data for analysis.
Expertise in tools like PowerBI, SQL, and Python is crucial. Expertise in programs like Microsoft Excel, SQL , and business intelligence (BI) tools like PowerBI or Tableau allows analysts to process and visualise data efficiently. AI and automation play a central role in the evolving role.
The field has evolved significantly from traditional statistical analysis to include sophisticated Machine Learning algorithms and Big Data technologies. Issues such as algorithmic bias, data privacy, and transparency are becoming critical topics of discussion within the industry.
Tools like Tableau, PowerBI, and D3.js Text mining algorithms extract key insights from text data, such as sentiment polarity, topic modelling, and keyword extraction. PowerBI A powerful and versatile tool from Microsoft, PowerBI integrates seamlessly with other Microsoft products like Excel.
For example, financial institutions utilise high-frequency trading algorithms that analyse market data in milliseconds to make investment decisions. Key tools include: Business Intelligence (BI) Tools : Software like Tableau or PowerBI allows users to visualise and analyse complex datasets easily.
For example, financial institutions utilise high-frequency trading algorithms that analyse market data in milliseconds to make investment decisions. Key tools include: Business Intelligence (BI) Tools : Software like Tableau or PowerBI allows users to visualise and analyse complex datasets easily.
Knowledge of Core Data Engineering Concepts Ensure one possess a strong foundation in core data engineering concepts, which include data structures, algorithms, database management systems, data modeling , data warehousing , ETL (Extract, Transform, Load) processes, and distributed computing frameworks (e.g., Hadoop, Spark).
AI encompasses various technologies and applications, from simple algorithms to complex neural networks. On the other hand, ML focuses specifically on developing algorithms that allow machines to learn and make predictions or decisions based on data. Key Features: Challenging problem sets to build coding and algorithm skills.
Just as a writer needs to know core skills like sentence structure and grammar, data scientists at all levels should know core data science skills like programming, computer science, algorithms, and soon. AlgorithmsAlgorithms form the backbone of data science, enabling models to process data, identify patterns, and make predictions.
Because they are the most likely to communicate data insights, they’ll also need to know SQL, and visualization tools such as PowerBI and Tableau as well. Some of the tools and techniques unique to business analysts are pivot tables, financial modeling in Excel, PowerBI Dashboards for forecasting, and Tableau for similar purposes.
While a data analyst isn’t expected to know more nuanced skills like deep learning or NLP, a data analyst should know basic data science, machine learning algorithms, automation, and data mining as additional techniques to help further analytics. As you see, there are a number of reporting platforms as expected.
Modeling & Algorithms: Applying statistical models (like regression, classification, clustering) or Machine Learning algorithms to identify deeper patterns, make predictions, or classify data points. to understand the data’s main characteristics, distributions, and relationships. This helps formulate hypotheses.
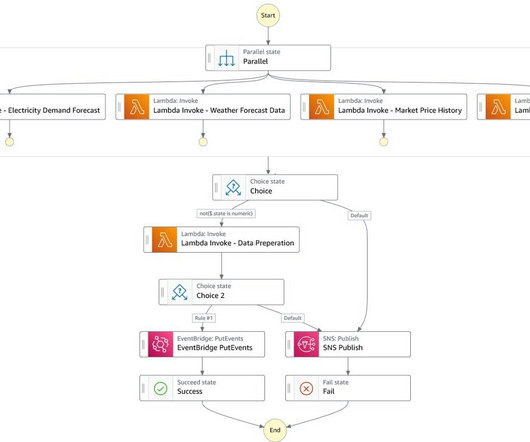
SageMaker enables Marubeni to run ML and numerical optimization algorithms in a single environment. Developers and business analysts can then explore the data using Athena and Microsoft PowerBI for visualization. The data can also be made available via API to downstream business applications.
Price Optimization Software Tools like PROS or Vendavo use advanced algorithms to analyse historical sales data and predict optimal prices based on various factors such as demand elasticity and competitor actions. Below are some of the most effective tools and techniques used in Pricing Analytics.
Machine Learning Algorithms Basic understanding of Machine Learning concepts and algorithm s, including supervised and unsupervised learning techniques. Students should learn how to leverage Machine Learning algorithms to extract insights from large datasets. js for creating interactive visualisations.
Here are steps you can follow to pursue a career as a BI Developer: Acquire a solid foundation in data and analytics: Start by building a strong understanding of data concepts, relational databases, SQL (Structured Query Language), and data modeling.
For example, a data scientist might develop a machine-learning algorithm to predict customer churn, while a data analyst would analyze customer data to understand why churn occurred in the past. Banks employ sophisticated algorithms to analyze transaction patterns and identify suspicious activities in real-time.
Algorithm Development: Crafting algorithms to solve complex business problems and optimise processes. Statistical and Machine Learning Expertise: Understanding statistical analysis, Machine Learning algorithms , and model evaluation. Finance: Creating fraud detection algorithms to improve security and risk management.
Programs like Pickl.AI’s Data Science Job Guarantee Course promise data expertise including statistics, PowerBI , Machine Learning and guarantee job placement upon completion. Gain insights using scientific methods and algorithms. A must for college graduates exploring Data Science careers.
We organize all of the trending information in your field so you don't have to. Join 17,000+ users and stay up to date on the latest articles your peers are reading.
You know about us, now we want to get to know you!
Let's personalize your content
Let's get even more personalized
We recognize your account from another site in our network, please click 'Send Email' below to continue with verifying your account and setting a password.


Let's personalize your content