This site uses cookies to improve your experience. To help us insure we adhere to various privacy regulations, please select your country/region of residence. If you do not select a country, we will assume you are from the United States. Select your Cookie Settings or view our Privacy Policy and Terms of Use.
Cookie Settings
Cookies and similar technologies are used on this website for proper function of the website, for tracking performance analytics and for marketing purposes. We and some of our third-party providers may use cookie data for various purposes. Please review the cookie settings below and choose your preference.
Used for the proper function of the website
Used for monitoring website traffic and interactions
Cookie Settings
Cookies and similar technologies are used on this website for proper function of the website, for tracking performance analytics and for marketing purposes. We and some of our third-party providers may use cookie data for various purposes. Please review the cookie settings below and choose your preference.
Strictly Necessary: Used for the proper function of the website
Performance/Analytics: Used for monitoring website traffic and interactions
Overview Learn about the integration capabilities of PowerBI with Azure Machine Learning (ML) Understand how to deploy machine learning models in a production. The post The Power of Azure ML and PowerBI: Dataflows and Model Deployment appeared first on Analytics Vidhya.
IDP combines optical character recognition (OCR) technology with AI and ML algorithms to extract data and insights from documents, reducing the need for manual data […] The post Intelligent Document Processing with Azure Form Recognizer appeared first on Analytics Vidhya.
PowerBI is a powerful data visualization tool that helps them turn raw data into meaningful insights and actionable decisions. In this blog, we will explore the role of data analysts and how they use PowerBI to extract insights from data and drive business success. How does a data analyst use PowerBI?
It offers full BI-Stack Automation, from source to data warehouse through to frontend. It also supports a wide range of data warehouses, analytical databases, data lakes, frontends, and pipelines/ETL. Data Lakes : It supports MS Azure Blob Storage. pipelines, Azure Data Bricks.
How to Optimize PowerBI and Snowflake for Advanced Analytics Spencer Baucke May 25, 2023 The world of business intelligence and data modernization has never been more competitive than it is today. Much of what is discussed in this guide will assume some level of analytics strategy has been considered and/or defined.
Microsoft has made good on its promise to deliver a simplified and more efficient Microsoft Fabric price model for its end-to-end platform designed for analytics and data workloads. Microsoft’s unified pricing model for the Fabric suite marks a significant advancement in the analytics and data market.
Microsoft Fabric is a cutting-edge analytics platform that helps data experts and companies work together on data projects. OneLake, being built on Azure Data Lake Storage (ADLS), supports various data formats, including Delta, Parquet, CSV, and JSON. Now, we can save the data as delta tables to use later for sales analytics.
PowerBI Desktop is a wonderful business intelligence tool that has an expansive list of reporting capabilities, but there is one thing that you aren’t able to do with it – create a paginated report, which is a specific style of report that is designed to be exported or printed. What Is PowerBI Report Builder?
Skills and Training Familiarity with ethical frameworks like the IEEE’s Ethically Aligned Design, combined with strong analytical and compliance skills, is essential. Strong analytical skills and the ability to work with large datasets are critical, as is familiarity with data modeling and ETL processes.
Summary: Business Analytics focuses on interpreting historical data for strategic decisions, while Data Science emphasizes predictive modeling and AI. Introduction In today’s data-driven world, businesses increasingly rely on analytics and insights to drive decisions and gain a competitive edge. What is Business Analytics?
They’ve tried to do this with the existing report created with PowerBI Desktop, and they can only see a small subset of the data from the table visualization when they export the report page as a PDF. In this blog post, we will introduce you to paginated reports in PowerBI and show you how to create one using PowerBI Report Builder.
This weeks news includes information about AWS working with Azure, time-series, detecting text in videos and more. Amazon Redshift now supports Authentication with Microsoft Azure AD Redshift, a data warehouse, from Amazon now integrates with Azure Active Directory for login. Welcome to Cloud Data Science 8. Training / Courses.
Summary : Microsoft Fabric is an end-to-end Data Analytics platform designed for integration, processing, and advanced insights, while PowerBI excels in creating interactive visualisations and reports. Key Takeaways Microsoft Fabric is a full-scale data platform, while PowerBI focuses on visualising insights.
Vielfältige Unterstützung: Kompatibel mit verschiedenen Datenbankmanagementsystemen wie MS SQL Server und Azure Synapse Analytics. Data Lakes: Unterstützt MS Azure Blob Storage. Frontends : Kompatibel mit Tools wie PowerBI, Qlik Sense und Tableau.
Summary: PowerBI is a business analytics tool transforming data into actionable insights. Key features include AI-poweredanalytics, extensive data connectivity, customisation options, and robust data modelling. It offers AI-driven analytics, including Natural Language Processing. Why PowerBI?
The Datamarts capability opens endless possibilities for organizations to achieve their data analytics goals on the PowerBI platform. Before we look into the PowerBI Datamarts, let us take a step back and understand the meaning of a Datamart. What is PowerBI Datamarts?
As everyone knows, PowerBI is one of the best tools in the data analytics market for creating and sharing reports using the PowerBI service. We will also explain the backend process of establishing gateway connections and its advantages, which help in reporting effectively through PowerBI.
Summary: Data Visualisation is crucial to ensure effective representation of insights tableau vs powerbi are two popular tools for this. This article compares Tableau and PowerBI, examining their features, pricing, and suitability for different organisations. What is PowerBI? billion in 2023.
Summary: PowerBI is a leading data analytics platform offering advanced features like real-time analytics and collaborative capabilities. Understanding its significance is vital for aspiring PowerBI developers. Optimising PowerBI reports for performance ensures efficient data analysis.
Driving a data culture is now a lot more — well, driven — thanks to the latest of Alation’s 80+ connectors : PowerBI Scanner, which unifies self-service and enterprise analytics and allows users to find answers fast with industry-leading AI. What Is the Significance of the Alation & PowerBI Partnership?
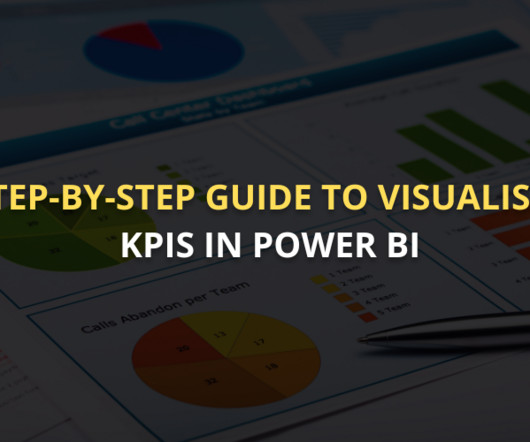
Summary: This guide covers visualising KPI in PowerBI, from setting up the tool and preparing data to selecting the right visuals and enhancing dashboards. PowerBI is an excellent tool for this purpose, offering powerful features to create interactive, dynamic visualisations that bring data to life.
Data Drift Monitoring for Azure ML Datasets Azure ML now provides monitoring for when your data changes (called data drift). Courses & Learning. Upcoming Online ML/AI Conference, AWS Innovate A free, online conference hosted by Amazon Web Services.
In this blog post, we will discuss how the Power Platform Copilot […] The post Microsoft Power Platform Copilot: The Dawn of a New Era in Low-Code Development appeared first on Analytics Vidhya.
Summary: “Data Science in a Cloud World” highlights how cloud computing transforms Data Science by providing scalable, cost-effective solutions for big data, Machine Learning, and real-time analytics. Centralised access enhances teamwork and accelerates analytics projects.
The Event Log Data Model for Process Mining Process Mining as an analytical system can very well be imagined as an iceberg. An object-centric data model is a big deal because it offers the opportunity for a holistic approach and as a database a single source of truth for Process Mining but also for other types of analytical applications.
By presenting data visually, organisations can communicate insights more clearly and drive strategic decisions based on real-time analytics. Supports predictive analytics to anticipate market trends and behaviours. Social Media Analytics Platforms like Facebook use Big Data visualization to analyse user engagement metrics.
PowerBI Datamarts is one of the most exciting features that Microsoft has released for the Power Platform in recent years. If you need high-level information on what a PowerBI Datamart is and some example use cases, check out our other blog, What Are PowerBI Datamarts?
Summary: This blog provides a comprehensive roadmap for aspiring Azure Data Scientists, outlining the essential skills, certifications, and steps to build a successful career in Data Science using Microsoft Azure. This roadmap aims to guide aspiring Azure Data Scientists through the essential steps to build a successful career.
Process Mining wurde kürzlich in die Power Automate Plattform und in PowerBI integriert. Process Mining Tools, die Business Intelligence Software erweitern Und dann gibt es noch diejenigen Anbieter, die bestehende BI Tools mit Erweiterungen zum Process Mining Analysewerkzeug machen. nicht mehr weiterentwickelt wird.
Summary: Descriptive Analytics tools transform historical data into visual reports, helping businesses identify trends and improve decision-making. Popular tools like PowerBI, Tableau, and Google Data Studio offer unique features for Data Analysis. What is Descriptive Analytics?
Explore, analyze, and visualize data with our Introduction to PowerBI training & make data-driven decisions. 2. Building Enterprise-Grade Q&A Chatbots with Azure OpenAI: In this tutorial, we explore the features of Azure OpenAI and demonstrate how to further improve the platform by fine-tuning some of its models.
The current BI trends show that in the future, the BI software will be more accessible, so that even non-techie workers will rely on data insights in their working routine. This shows why self-service BI is on the rise. Prescriptive Analytics. Automation & Augmented Analytics. SAP Lumira.
Choosing the right certification enhances career growth and opens doors to better opportunities in Data Analytics. The global Data Analytics market, valued at USD 41.05 Essential Skills for Data Analysts Strong analytical skills top the list of requirements for a Data Analyst.
As the sibling of data science, data analytics is still a hot field that garners significant interest. We looked at over 25,000 job descriptions, and these are the data analytics platforms, tools, and skills that employers are looking for in 2023.
This article will serve as an ultimate guide to choosing between Data Science and Data Analytics. Some individuals are confused about the right path to choose between the two lucrative careers — Data Science and Data Analytics. Experience with cloud platforms like; AWS, AZURE, etc. Basic programming knowledge in R or Python.
Looking to take your data analytics and visualization to the next level? Check out this course and learn PowerBI today! SSPM vs. CSPM CSPM SSPM Focus areas Watching over cloud services like Azure, Cloud, and AWS. Some solutions additionally protect unique applications.
I’m talking about not just Walt Disney World, but also this year’s Gartner Data & Analytics Summit , which took place last month in Orlando at the landmark resort. The post Insights from Gartner Data & Analytics Summit Orlando 2023 appeared first on Alation. It’s the place where dreams come true.
PowerBI Integration It brings real-time analytics and advanced reporting capabilities to Excel. PowerBI’s AI features complement Excel’s functionalities by enabling more sophisticated data visualisations and interactive dashboards. Integrate with PowerBI Integrate Excel with PowerBI for advanced analytics.
Tools like Tableau, PowerBI, and Python libraries such as Matplotlib and Seaborn are commonly taught. Cloud Computing : Utilizing cloud services for data storage and processing, often covering platforms such as AWS, Azure, and Google Cloud. R : Often used for statistical analysis and data visualization.
EVENT — ODSC East 2024 In-Person and Virtual Conference April 23rd to 25th, 2024 Join us for a deep dive into the latest data science and AI trends, tools, and techniques, from LLMs to data analytics and from machine learning to responsible AI. Prefect’s design is particularly suited for modern cloud-based data environments.
It involves the development and application of methods, data analytics, and software to address key questions in biology. Becoming a Bioinformatics Scientist To become a Bioinformatics Scientist, you need a strong foundation in biological sciences, computer programming, and data analytics.
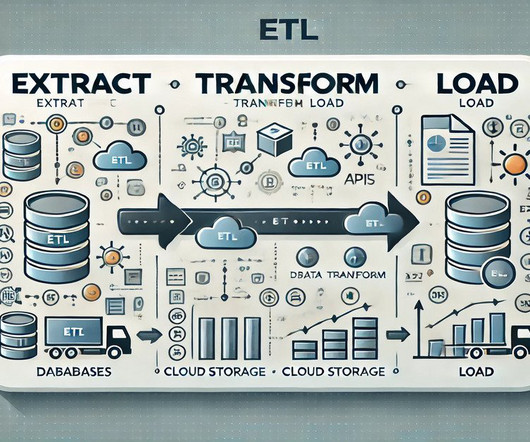
The final step is loading, which involves placing the transformed data into a centralised system for further use, such as reporting or analytics. Its ability to integrate with cloud platforms like AWS and Azure makes it an excellent choice for businesses moving to the cloud. This stage may involve filtering, sorting, or merging data.
Key components include data storage solutions, processing frameworks, analytics tools, and governance practices. Analytics tools help convert raw data into actionable insights for businesses. Real-time analytics are becoming increasingly important for businesses that need to respond quickly to market changes. What is Big Data?
We organize all of the trending information in your field so you don't have to. Join 17,000+ users and stay up to date on the latest articles your peers are reading.
You know about us, now we want to get to know you!
Let's personalize your content
Let's get even more personalized
We recognize your account from another site in our network, please click 'Send Email' below to continue with verifying your account and setting a password.


Let's personalize your content