This site uses cookies to improve your experience. To help us insure we adhere to various privacy regulations, please select your country/region of residence. If you do not select a country, we will assume you are from the United States. Select your Cookie Settings or view our Privacy Policy and Terms of Use.
Cookie Settings
Cookies and similar technologies are used on this website for proper function of the website, for tracking performance analytics and for marketing purposes. We and some of our third-party providers may use cookie data for various purposes. Please review the cookie settings below and choose your preference.
Used for the proper function of the website
Used for monitoring website traffic and interactions
Cookie Settings
Cookies and similar technologies are used on this website for proper function of the website, for tracking performance analytics and for marketing purposes. We and some of our third-party providers may use cookie data for various purposes. Please review the cookie settings below and choose your preference.
Strictly Necessary: Used for the proper function of the website
Performance/Analytics: Used for monitoring website traffic and interactions
Overview Tableau vs. Qlik Sense – Each Analytics and BusinessIntelligence tool has its own distinct set of features We’ll compare Tableau and Qlik. The post Tableau vs. Qlik Sense – Which Analytics and BusinessIntelligence Tool Should you Use?
Overview Analytics and BusinessIntelligence provide comprehensible view of the company and derive actionable insights. We’ll discuss 6 top businessintelligence tools that you. The post 6 Top Tools for Analytics and BusinessIntelligence in 2020 appeared first on Analytics Vidhya.
Introduction Tableau has emerged as a popular data visualization tool in companies, making it one of the hottest trends in BusinessIntelligence. In India, people are curious about the Tableau developer salary statistics. We will […] The post What is the Tableau Developer Salary in India?
Introduction to Tableau Tips! Creating a chart or visual in Tableau is. The post 5 Tableau Tips for Designing a Tidy and Impactful Visualization appeared first on Analytics Vidhya. This article was published as a part of the Data Science Blogathon.
Discover which features will differentiate your application and maximize the ROI of your embedded analytics. Brought to you by Logi Analytics. But today, dashboards and visualizations have become table stakes.
Introduction Tableau is a data visualization tool created in Salesforce that allows users to connect to any database, like SQL or MongoDB, and interact freely. It is widely used in the BusinessIntelligence industry, and raw data is quickly simplified to any format […].
What’s the best BusinessIntelligence and Analytics tool in the market? A plethora of data science and businessintelligence professionals and organizations have asked. Check out the latest developments in Best Analytics Tools appeared first on Analytics Vidhya.
The main role in decision-making reflected in this choice is assigned to BusinessIntelligence Analyst who provides relevant information to be used in decision-making. This role is very crucial in the ability […] The post Who is a BusinessIntelligence Analyst and How to Become One?
Overview Animated visualizations are a work of art and are really easy to create in Tableau We’ll work with open-source datasets here and create. The post Build your own Animated Data Visualization in Tableau in Just 5 Minutes appeared first on Analytics Vidhya.
The post Make Your Tableau Visuals More Effective – Tips And Tricks appeared first on Analytics Vidhya. ArticleVideo Book This article was published as a part of the Data Science Blogathon. Introduction Data Visualization is a graphical way to represent data by.
While different companies, regardless of their size, have different operational processes, they share a common need for actionable insight to drive success in their business. Advancement in big data technology has made the world of business even more competitive. This eliminates guesswork when coming up with business strategies.
This week, Gartner published the 2021 Magic Quadrant for Analytics and BusinessIntelligence Platforms. Gartner has again recognized Tableau as a Leader—for our ninth consecutive year. . I first want to thank you, the Tableau Community, for your continued support and your commitment to data, to Tableau, and to each other.
Chief Product Officer, Tableau. Tableau has been named a Leader in the Gartner Magic Quadrant for Analytics & BusinessIntelligence Platforms for the 10th consecutive year. We believe a decade as a Leader is an incredible milestone—and it wouldn’t be possible without you, our amazing Tableau Community. .
Chief Product Officer, Tableau. Tableau has been named a Leader in the Gartner Magic Quadrant for Analytics & BusinessIntelligence Platforms for the 10th consecutive year. We believe a decade as a Leader is an incredible milestone—and it wouldn’t be possible without you, our amazing Tableau Community. .
Or regularly build dashboards and visualizations in Tableau or Power BI? The post Infographic: 11 Steps to Transition into Data Science (for Reporting / MIS / BI Professionals) appeared first on Analytics Vidhya. Introduction Do you often work with reports in Excel? If you answered yes.
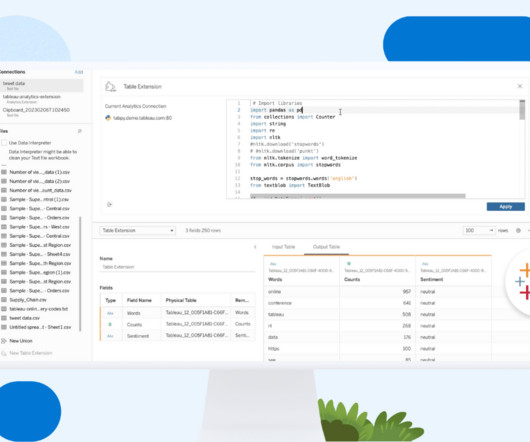
Swetha Bezawada Senior Data Scientist Colten Woo September 26, 2023 - 6:57pm October 2, 2023 The typical analytical ecosystem has two silos: businessintelligence and data science. Analytics Extensions do just that! This data can then be scored, transformed, or augmented to facilitate dynamic exploration.
More and more often, businesses are using data to drive their decisions — which makes cutting-edge analytics and businessintelligence strategies one of the best advantages a company can have. Here are the six trends you should be aware of that will reshape businessintelligence in 2020 and throughout the new decade.
Spencer Czapiewski September 12, 2024 - 8:38pm Karen Madera Senior Manager, Product Marketing, Tableau We’re in the midst of an autonomous revolution that’s reshaping the way businesses use data to gain a competitive edge, delight customers, and engage employees. Some just want answers delivered to them in the context of their work.
Generative AI (GenAI) is stepping in to change the game by making data analytics accessible to everyone. As data keeps growing, tools powered by Generative AI for data analytics are helping businesses and individuals tap into this potential, making decisions faster and smarter.
As the use of intelligence technologies is staggering, knowing the latest trends in businessintelligence is a must. The market for businessintelligence services is expected to reach $33.5 top 5 key platforms that control the future of businessintelligence impacts BI may have on your business in the future.
Technical Fellow, Tableau. Tableau has been helping people and organizations to see and understand data for almost two decades, bringing exciting innovations to the landscape of businessintelligence with every product release. Navigating the History of Tableau Innovation viz. Jock Mackinlay. Bronwen Boyd.
Companies use BusinessIntelligence (BI), Data Science , and Process Mining to leverage data for better decision-making, improve operational efficiency, and gain a competitive edge. So while Process Mining can be seen as a subpart of BI while both are using Machine Learning for better analytical results.
Swetha Bezawada Senior Data Scientist Colten Woo September 26, 2023 - 6:57pm October 2, 2023 The typical analytical ecosystem has two silos: businessintelligence and data science. Analytics Extensions do just that! This data can then be scored, transformed, or augmented to facilitate dynamic exploration.
Business reporting has been around for a long time but the tools and techniques of businessintelligence have refined over time and now with the recent popularity of data driven business approach, data has been identified as the most valuable asset of a business and data analytics and reporting has finally found a key place in the business world.
Open source businessintelligence software is a game-changer in the world of data analysis and decision-making. It has revolutionized the way businesses approach data analytics by providing cost-effective and customizable solutions that are tailored to specific business needs.
Big or small, every business needs good tools to analyze data and develop the most suitable business strategy based on the information they get. Businessintelligence tools are means that help companies get insights from their data and get a better understanding of what directions and trends to follow. Zoho Analytics.
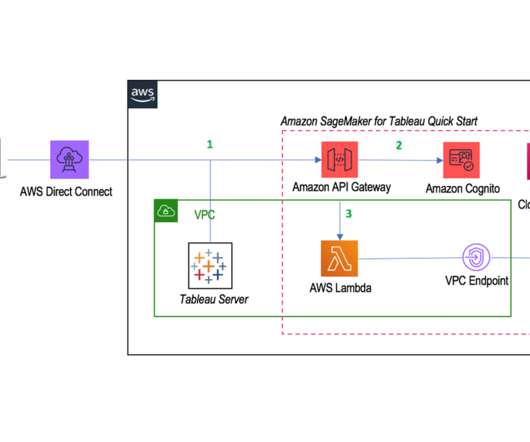
Product Manager, Tableau . Dylan Tong, Global Segment Lead Architect, AI Augmented Analytics, AWS. The ability to forecast demand and predict behavior can drive business growth, reduce churn and attrition, and optimize processes and supply chains. . Amazon SageMaker for Tableau architecture. Kristin Adderson.
Google BigQuery: Google BigQuery is a serverless, cloud-based data warehouse designed for big data analytics. It integrates well with other Google Cloud services and supports advanced analytics and machine learning features. Apache Spark: Apache Spark is an open-source, unified analytics engine designed for big data processing.
Ateken Abla March 19, 2024 - 9:05pm Larissa Amoroso Vice President, Tableau Community, Tableau When Karolina Grodzinska took the stage at Tableau Conference as part of her Iron Viz: Student Edition award, it felt like the culmination of her data learning, which started in 2021. How did Karolina discover Tableau? “It
Social Media and Blog Specialist, Tableau. Tableau Ambassadors teach and share while fostering a positive and supportive space within the data community. Tableau Ambassadors serve one-year terms in one of seven branches: Forums, User Groups, Student, DataDev, Public, Social, and CRM Analytics. Bronwen Boyd. Britt Staniar.
Guest author, Tableau DataDev Ambassador. Tableau is an innovator in the field of data visualization with its ease of use, stunning visualizations, vibrant community, and more contributing to success. Tableau recognizes that the way we use data today and the field of analytics is much different now than even a decade ago.
Senior Director Global Partner Marketing, Tableau. That’s why we created the Tableau Partner Network (TPN)—to pair customers like you with a global network of partners focused on helping you solve your toughest data analytics challenges. . Kristin Adderson. July 15, 2021 - 6:20pm. July 15, 2021. So do our partners.
An interactive analytics application gives users the ability to run complex queries across complex data landscapes in real-time: thus, the basis of its appeal. Interactive analytics applications present vast volumes of unstructured data at scale to provide instant insights. Why Use an Interactive Analytics Application?
Kristin Adderson December 19, 2023 - 7:38pm Zach Bowders Tableau Visionary and Tableau Ambassador, BusinessIntelligence Specialist Zach Bowders, MBA is a data analyst, artist, and host of the Data+Love Podcast. View Zach’s data viz portfolio on Tableau Public—including several visualizations on movies.
Guest author, Tableau DataDev Ambassador. Tableau is an innovator in the field of data visualization with its ease of use, stunning visualizations, vibrant community, and more contributing to success. Tableau recognizes that the way we use data today and the field of analytics is much different now than even a decade ago.
The post 22 Widely Used Data Science and Machine Learning Tools in 2020 appeared first on Analytics Vidhya. Overview There are a plethora of data science tools out there – which one should you pick up? Here’s a list of over 20.
In the early days of analytics, only the largest companies could afford to leverage big data. All that’s changed and now there are accessible tools for businesses of all sizes. But which tools are the most effective for businesses in 2021? 5 Best Analytic Tools in 2021. Choosing an Analytics Tool. RapidMiner.
Senior Director, Product Management, Tableau. Tableau partner Snowflake surveyed business and technology leaders to learn what it means to win in the data economy , what characterizes leaders and laggards, and how it’s important to care about data to achieve successful outcomes. Nicolas Brisoux. Kristin Adderson. August 1, 2022.
It’s hard to overestimate the value that data insights have come to represent to today’s businesses. Investments in analytics tech have risen commensurately, with some 73 percent of respondents telling IDC that they expect to spend more on data-focused software than any other category in 2023. Consolidating Information.
Technical Fellow, Tableau. Tableau has been helping people and organizations to see and understand data for almost two decades, bringing exciting innovations to the landscape of businessintelligence with every product release. Navigating the History of Tableau Innovation viz. Jock Mackinlay. Bronwen Boyd.
Senior Director, Product Management, Tableau. Tableau partner Snowflake surveyed business and technology leaders to learn what it means to win in the data economy , what characterizes leaders and laggards, and how it’s important to care about data to achieve successful outcomes. Nicolas Brisoux. Kristin Adderson. August 1, 2022.
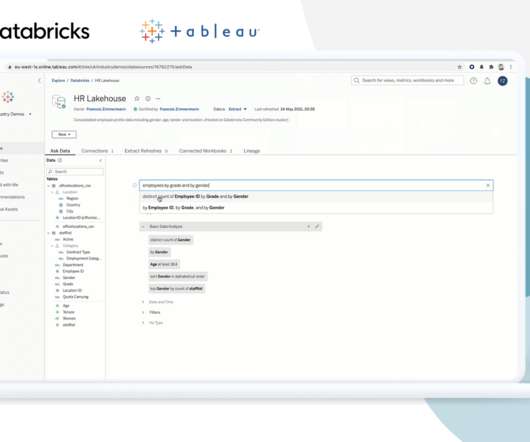
EMEA Field CTO, Tableau. In many of the conversations we have with IT and business leaders, there is a sense of frustration about the speed of time-to-value for big data and data science projects. The lakehouse model provides distinct advantages for Tableau customers. Francois Zimmermann. Brian Dirking. Kristin Adderson.
Product Marketing Manager, Embedded Analytics, Tableau. Embedding analytics is a way we can help our customers make smarter decisions and achieve greater success. When creating an embedded analytics offering, the biggest decision is whether to build an in-house solution or purchase a turnkey solution. . Bronwen Boyd.
This week, Gartner published the 2021 Magic Quadrant for Analytics and BusinessIntelligence Platforms. Gartner has again recognized Tableau as a Leader—for our ninth consecutive year. . I first want to thank you, the Tableau Community, for your continued support and your commitment to data, to Tableau, and to each other.
We organize all of the trending information in your field so you don't have to. Join 17,000+ users and stay up to date on the latest articles your peers are reading.
You know about us, now we want to get to know you!
Let's personalize your content
Let's get even more personalized
We recognize your account from another site in our network, please click 'Send Email' below to continue with verifying your account and setting a password.


Let's personalize your content