This site uses cookies to improve your experience. To help us insure we adhere to various privacy regulations, please select your country/region of residence. If you do not select a country, we will assume you are from the United States. Select your Cookie Settings or view our Privacy Policy and Terms of Use.
Cookie Settings
Cookies and similar technologies are used on this website for proper function of the website, for tracking performance analytics and for marketing purposes. We and some of our third-party providers may use cookie data for various purposes. Please review the cookie settings below and choose your preference.
Used for the proper function of the website
Used for monitoring website traffic and interactions
Cookie Settings
Cookies and similar technologies are used on this website for proper function of the website, for tracking performance analytics and for marketing purposes. We and some of our third-party providers may use cookie data for various purposes. Please review the cookie settings below and choose your preference.
Strictly Necessary: Used for the proper function of the website
Performance/Analytics: Used for monitoring website traffic and interactions
Chief Product Officer, Tableau. It's more important than ever in this all digital, work from anywhere world for organizations to use data to make informed decisions. However, most organizations struggle to become data driven. With Tableau, any user can visually explore that data in real time. Francois Ajenstat.
Chief Product Officer, Tableau. It's more important than ever in this all digital, work from anywhere world for organizations to use data to make informed decisions. However, most organizations struggle to become data driven. With Tableau, any user can visually explore that data in real time. Francois Ajenstat.
National Solutions Engineer, Tableau . Welcome to our monthly highlight of data viz tips, tricks and inspiration produced by the Tableau Community. Avinash Reddy Munnangi recently wrote a blog post on 10 Reasons Why You Need a Tableau Public Profile , and it’s spot on! Adam Mico: Tableau-ing to the Fullest….
This week, Gartner published the 2021 Magic Quadrant for Analytics and Business Intelligence Platforms. Gartner has again recognized Tableau as a Leader—for our ninth consecutive year. . I first want to thank you, the Tableau Community, for your continued support and your commitment to data, to Tableau, and to each other.
Throughout the pandemic, Tableau has partnered with experts and organizations to help people around the world see and understand global COVID-19 data. With 400 million views and counting, our COVID-19 Data Hub has helped governments and organizations inform and guide decision-making. . Share data from your desk or on the go .
This week, Gartner published the 2021 Magic Quadrant for Analytics and Business Intelligence Platforms. Gartner has again recognized Tableau as a Leader—for our ninth consecutive year. . I first want to thank you, the Tableau Community, for your continued support and your commitment to data, to Tableau, and to each other.
National Solutions Engineer, Tableau . Welcome to our monthly highlight of data viz tips, tricks and inspiration produced by the Tableau Community. Avinash Reddy Munnangi recently wrote a blog post on 10 Reasons Why You Need a Tableau Public Profile , and it’s spot on! Adam Mico: Tableau-ing to the Fullest….
Senior Manager, Product Marketing, Tableau. By now, you’ve heard the good news: The business world is embracing data-driven decision making and growing their data practices at an unprecedented clip. At Tableau, we believe that the best decisions are made when everyone is empowered to put data at the center of every conversation.
Senior Manager, Product Marketing, Tableau. By now, you’ve heard the good news: The business world is embracing data-driven decision making and growing their data practices at an unprecedented clip. At Tableau, we believe that the best decisions are made when everyone is empowered to put data at the center of every conversation.
Throughout the pandemic, Tableau has partnered with experts and organizations to help people around the world see and understand global COVID-19 data. With 400 million views and counting, our COVID-19 Data Hub has helped governments and organizations inform and guide decision-making. . Share data from your desk or on the go .
Vice President, Product, Tableau. Did you know 80% of data-driven businesses said they gained a critical advantage during the pandemic? Having complete, accurate data in all employees’ hands and workstreams helps organizations solve business problems with the customer journey in mind—especially in rapidly changing markets.
Vice President, Product, Tableau. Did you know 80% of data-driven businesses said they gained a critical advantage during the pandemic? Having complete, accurate data in all employees’ hands and workstreams helps organizations solve business problems with the customer journey in mind—especially in rapidly changing markets.
Ryan Cairnes Senior Manager, Product Management, Tableau Hannah Kuffner July 28, 2020 - 10:43pm March 20, 2023 Tableau Prep is a citizen data preparation tool that brings analytics to anyone, anywhere. With Prep, users can easily and quickly combine, shape, and cleandata for analysis with just a few clicks.
Ryan Cairnes Senior Manager, Product Management, Tableau Hannah Kuffner July 28, 2020 - 10:43pm March 20, 2023 Tableau Prep is a citizen data preparation tool that brings analytics to anyone, anywhere. With Prep, users can easily and quickly combine, shape, and cleandata for analysis with just a few clicks.
Data scientists must decide on appropriate strategies to handle missing values, such as imputation with mean or median values or removing instances with missing data. The choice of approach depends on the impact of missing data on the overall dataset and the specific analysis or model being used.
In this way, Alation is empowering business users to use trusted data more wisely (and compliantly!) Business leaders are data leaders According to a Global Data and Analytics Survey conducted by PwC, highly data-driven organizations are 3 times more likely to report significant improvements in decision-making.
Summary: Data Analysis focuses on extracting meaningful insights from raw data using statistical and analytical methods, while data visualization transforms these insights into visual formats like graphs and charts for better comprehension. Deep Dive: What is Data Analysis? EDA: Calculate overall churn rate.
However, despite being a lucrative career option, Data Scientists face several challenges occasionally. The following blog will discuss the familiar Data Science challenges professionals face daily. It contains data clustering, classification, anomaly detection and time-series forecasting.
Moreover, this feature helps integrate data sets to gain a more comprehensive view or perform complex analyses. DataCleaningData manipulation provides tools to clean and preprocess data. Thus, Cleaningdata ensures data quality and enhances the accuracy of analyses.
In a business environment, a Data Scientist is involved to work with multiple teams laying out the foundation for analysing data. This implies that as a Data Scientist, you would engage in collecting, analysing and cleaningdata gathered from multiple sources. The post How to become a Data Scientist in 2023?
They can enroll for the Data Science course for kids. 5 Reasons to Learn Data Science as a Kid Learning Data Science as a kid can be a valuable and rewarding experience. Here are five reasons why: Critical Thinking Skills Acquiring data skills promotes analytical thinking.
Understanding Data Science Data Science is a multidisciplinary field that combines statistics, mathematics, computer science, and domain-specific knowledge to extract insights and wisdom from structured and unstructured data. Data Visualisation Visualisation of data is a critical skill.
Some of the popular ones include: Excel : A basic yet powerful tool for organising and analysing data. Tableau and Power BI : Visual tools that help present data in interactive charts and dashboards. By analysing data, businesses can identify growth opportunities, detect problems early, and improve their overall performance.
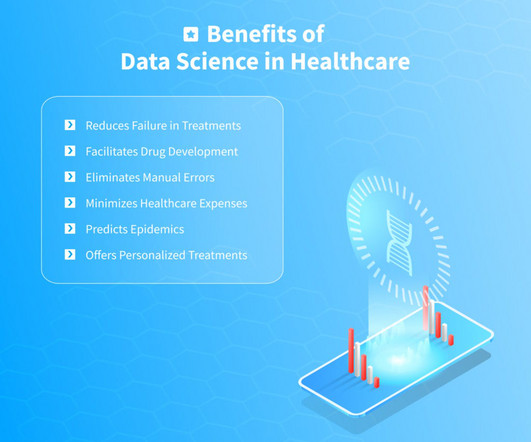
The next step involves applying analytical skills to discern patterns that can aid in diagnostic procedures. A data scientist in healthcare sifts through massive sets of data and runs various models and tests to identify any correlations and connections.
Tableau Dashboard from the 3rd Edition of Nonprofit Trends Report showing nonprofit organizations that exceeded goals by digital maturity. For Eric Dayton at buildOn, that meant being able to move full speed ahead with Tableau for Fundraising to unlock their donor data. “We Are you fielding questions like, “How’s the forecast?”
Tableau Dashboard from the 3rd Edition of Nonprofit Trends Report showing nonprofit organizations that exceeded goals by digital maturity. For Eric Dayton at buildOn, that meant being able to move full speed ahead with Tableau for Fundraising to unlock their donor data. “We Are you fielding questions like, “How’s the forecast?”
Source: The next big step forward for analytics engineering Picture the hustle it takes to keep that many models in line—ensuring they’re reliable, the dependencies make sense, and the data is solid. Tableau (beta) Google Sheets (beta) Hex Klipfolio PowerMetrics Lightdash Mode Push.ai
As the demand for data expertise continues to grow, understanding the multifaceted role of a data scientist becomes increasingly relevant. What is a data scientist? A data scientist integrates data science techniques with analytical rigor to derive insights that drive action.
User data analysis Chattermill is made for apps with tons of users, like BlaBlaCar and Uber. It uses artificial intelligence to do something that old-school analytics cant: make sense of all the different ways people express their thoughts and feelings about your app or service. Users upload the data theyve collected, and Julius.ai
We organize all of the trending information in your field so you don't have to. Join 17,000+ users and stay up to date on the latest articles your peers are reading.
You know about us, now we want to get to know you!
Let's personalize your content
Let's get even more personalized
We recognize your account from another site in our network, please click 'Send Email' below to continue with verifying your account and setting a password.


Let's personalize your content