This site uses cookies to improve your experience. To help us insure we adhere to various privacy regulations, please select your country/region of residence. If you do not select a country, we will assume you are from the United States. Select your Cookie Settings or view our Privacy Policy and Terms of Use.
Cookie Settings
Cookies and similar technologies are used on this website for proper function of the website, for tracking performance analytics and for marketing purposes. We and some of our third-party providers may use cookie data for various purposes. Please review the cookie settings below and choose your preference.
Used for the proper function of the website
Used for monitoring website traffic and interactions
Cookie Settings
Cookies and similar technologies are used on this website for proper function of the website, for tracking performance analytics and for marketing purposes. We and some of our third-party providers may use cookie data for various purposes. Please review the cookie settings below and choose your preference.
Strictly Necessary: Used for the proper function of the website
Performance/Analytics: Used for monitoring website traffic and interactions
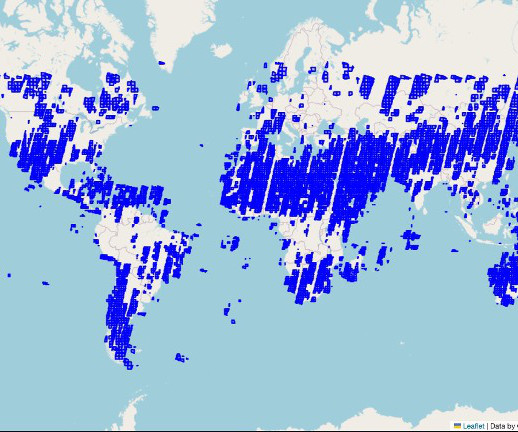
Introduction Voronoi diagrams, named after the Russian mathematician Georgy Voronoy, are fascinating geometric structures with applications in various fields such as computerscience, geography, biology, and urban planning.
Although setting up a processing cluster is an alternative, it introduces its own set of complexities, from data distribution to infrastructure management. We use the purpose-built geospatial container with SageMaker Processing jobs for a simplified, managed experience to create and run a cluster. format("/".join(tile_prefix),
It is important to consider the massive amount of compute often required to train these models. When using computeclusters of massive size, a single failure can often throw a training job off course and may require multiple hours of discovery and remediation from customers.
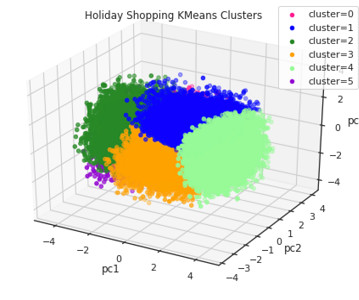
One of the simplest and most popular methods for creating audience segments is through K-means clustering, which uses a simple algorithm to group consumers based on their similarities in areas such as actions, demographics, attitudes, etc. In this tutorial, we will work with a data set of users on Foursquare’s U.S.
A right-sized cluster will keep this compressed index in memory. As an AI-centered platform, it creates direct pathways from customer feedback to product development, helping over 1,000 companies accelerate growth with accurate search, fast analytics, and customizable workflows.
Home Table of Contents Credit Card Fraud Detection Using Spectral Clustering Understanding Anomaly Detection: Concepts, Types and Algorithms What Is Anomaly Detection? Spectral clustering, a technique rooted in graph theory, offers a unique way to detect anomalies by transforming data into a graph and analyzing its spectral properties.
With technological developments occurring rapidly within the world, ComputerScience and Data Science are increasingly becoming the most demanding career choices. Moreover, with the oozing opportunities in Data Science job roles, transitioning your career from ComputerScience to Data Science can be quite interesting.
For training, we chose to use a cluster of trn1.32xlarge instances to take advantage of Trainium chips. We used a cluster of 32 instances in order to efficiently parallelize the training. We also used AWS ParallelCluster to manage cluster orchestration. Before moving to industry, Tahir earned an M.S.
Machine learning is a field of computerscience that uses statistical techniques to build models from data. Models: Bridging data and predictive insights Models, in the context of data science, are mathematical representations of real-world phenomena. There are many different types of models that can be used in data science.
This extension provides a robust monitoring solution, offering deeper insights and analytics tailored specifically for Neuron-based applications. The enhanced Container Insights page looks similar to the following screenshot, with the high-level summary of your clusters, along with kube-state and control-plane metrics.
ML is a computerscience, data science and artificial intelligence (AI) subset that enables systems to learn and improve from data without additional programming interventions. K-means clustering is commonly used for market segmentation, document clustering, image segmentation and image compression.
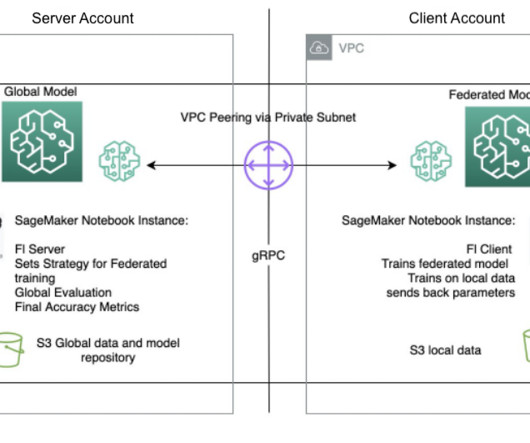
Finally, monitor and track the FL model training progression across different nodes in the cluster using the weights and biases (wandb) tool, as shown in the following screenshot. She helps partners, in the Healthcare and Life Sciences domain, design, develop, and scale state-of-the-art solutions leveraging AWS. He received his Ph.D.
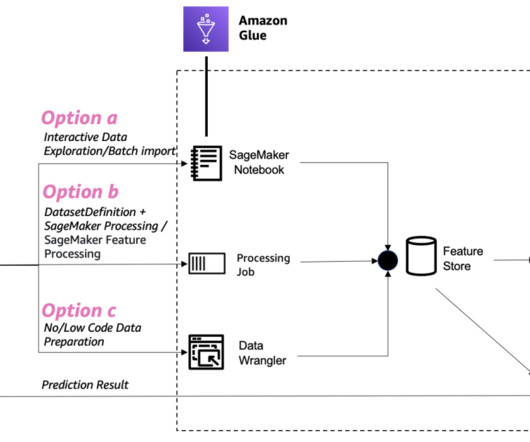
AWS Glue is a serverless data integration service that makes it easy to discover, prepare, and combine data for analytics, ML, and application development. Here we use RedshiftDatasetDefinition to retrieve the dataset from the Redshift cluster. We attached the IAM role to the Redshift cluster that we created earlier.
When storing a vector index for your knowledge base in an Aurora database cluster, make sure that the table for your index contains a column for each metadata property in your metadata files before starting data ingestion. Breanne holds a Bachelor of Science in Computer Engineering from University of Illinois at Urbana Champaign.
He focuses on Deep learning including NLP and Computer Vision domains. Greg Benson is a Professor of ComputerScience at the University of San Francisco and Chief Scientist at SnapLogic. Greg has published research in the areas of operating systems, parallel computing, and distributed systems.
In high performance computing (HPC) clusters, such as those used for deep learning model training, hardware resiliency issues can be a potential obstacle. It then replaces any faulty instances, if necessary, to make sure the training script starts running on a healthy cluster of instances.
In this blog post, I'll describe my analysis of Tableau's history to drive analytics innovation—in particular, I've identified six key innovation vectors through reflecting on the top innovations across Tableau releases. And with this work, I invite discussions about this history, my analysis, and the implications for the future of analytics.
To put it another way, a data scientist turns raw data into meaningful information using various techniques and theories drawn from many fields within the broad areas of mathematics, statistics, information science, and computerscience. Machine learning Machine learning is a key part of data science.
I mostly use U-SQL, a mix between C# and SQL that can distribute in very large clusters. Once the data is processed I do machine learning: clustering, topic finding, extraction, and classification. Do you use Stream Analytics? I have used Stream Analytics, but don’t use it a lot. I think of ComputerScience as a tool.
Delete your ECS cluster. Delete your EKS cluster. He holds a Bachelor’s degree in ComputerScience and Bioinformatics. He focuses on generative AI, AI/ML, and data analytics. Amazon ECS configuration For Amazon ECS, create a task definition that references your custom Docker image.
The financial services industry (FSI) is no exception to this, and is a well-established producer and consumer of data and analytics. This mostly non-technical post is written for FSI business leader personas such as the chief data officer, chief analytics officer, chief investment officer, head quant, head of research, and head of risk.
Bridging the Interpretability Gap in Customer Segmentation Evie Fowler | Senior Data Scientist | Fulcrum Analytics Historically, there have been two main approaches to segmentation: rules-based and machine learning-driven. It continues with the selection of a clustering algorithm and the fine-tuning of a model to create clusters.
Regardless, the database uses parallel processing to complete analytical queries. More like data centers, cloud platforms perform several services, including cloud storage, computation, cluster management, and data processing. To become a data engineer, you should complete a degree in computerscience or any other related field.
Machine Learning : Supervised and unsupervised learning algorithms, including regression, classification, clustering, and deep learning. Hence, data science bootcamps are well-positioned to meet the increasing demand for data science skills. Tools and frameworks like Scikit-Learn, TensorFlow, and Keras are often covered.
Solution overview We deploy FedML into multiple EKS clusters integrated with SageMaker for experiment tracking. EKS Blueprints helps compose complete EKS clusters that are fully bootstrapped with the operational software that is needed to deploy and operate workloads. Prachi Kulkarni is a Senior Solutions Architect at AWS.
In this blog post, I'll describe my analysis of Tableau's history to drive analytics innovation—in particular, I've identified six key innovation vectors through reflecting on the top innovations across Tableau releases. And with this work, I invite discussions about this history, my analysis, and the implications for the future of analytics.
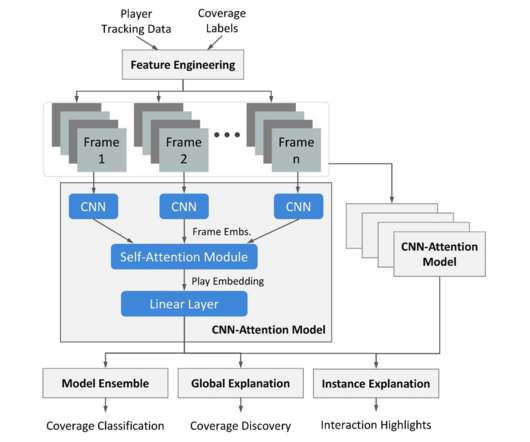
For instance, it can reveal the preferences of play callers, allow deeper understanding of how respective coaches and teams continuously adjust their strategies based on their opponent’s strengths, and enable the development of new defensive-oriented analytics such as uniqueness of coverages ( Seth et al. ).
Together, data engineers, data scientists, and machine learning engineers form a cohesive team that drives innovation and success in data analytics and artificial intelligence. Data Science vs. Model Development Data Scientists develop sophisticated machine-learning models to derive valuable insights and predictions from the data.
Dr Sonal Khosla (Speaker) holds a PhD in ComputerScience with a specialization in Natural Language Processing from Symbiosis International University, India with publications in peer reviewed Indexed journals. Computational Linguistics is rule based modeling of natural languages.
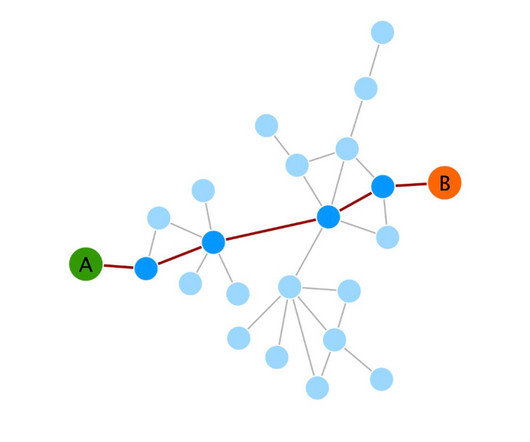
Graph visualization finds applications in various fields, such as computerscience, social network analysis, biology, and business. Node sizes indicate the degree of collaboration, while node colors represent clusters of authors based on their collaborative patterns. She received her Ph.D.
Natural Language Processing (NLP) This is a field of computerscience that deals with the interaction between computers and human language. Computer Vision This is a field of computerscience that deals with the extraction of information from images and videos.
This article explores the definitions of Data Science and AI, their current applications, how they are shaping the future, challenges they present, future trends, and the skills required for careers in these fields. Predictive analytics improves customer experiences in real-time.
Just as a writer needs to know core skills like sentence structure and grammar, data scientists at all levels should know core data science skills like programming, computerscience, algorithms, and soon. Theyre looking for people who know all related skills, and have studied computerscience and software engineering.
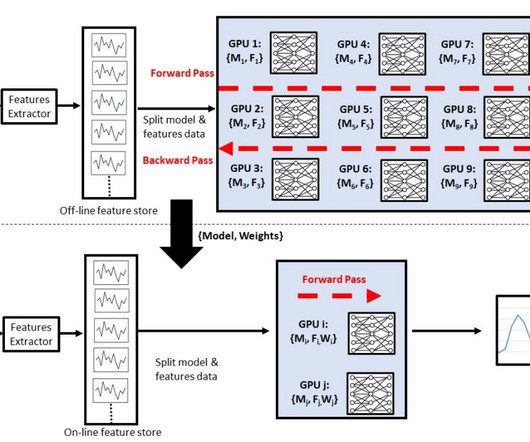
Usually, if the dataset or model is too large to be trained on a single instance, distributed training allows for multiple instances within a cluster to be used and distribute either data or model partitions across those instances during the training process. Each account or Region has its own training instances.
Empowering Data Scientists and Machine Learning Engineers in Advancing Biological Research Image from European Bioinformatics Institute Introduction: In biological research, the fusion of biology, computerscience, and statistics has given birth to an exciting field called bioinformatics.
It’s crucial to grasp these concepts, considering the exponential growth of the global Data Science Platform Market, which is expected to reach 26,905.36 Similarly, the Data and Analytics market is set to grow at a CAGR of 12.85% , reaching 15,313.99 More to read: How is Data Visualization helpful in Business Analytics?
Learning about the framework of a service cloud platform is time consuming and frustrating because there is a lot of new information from many different computing fields (computerscience/database, software engineering/developers, data science/scientific engineering & computing/research).
OpenSearch is an open source and distributed search and analytics suite derived from Elasticsearch. OpenSearch Service currently has tens of thousands of active customers with hundreds of thousands of clusters under management processing hundreds of trillions of requests per month.
If you spend even a few minutes on KNIME’s website or browsing through their whitepapers and blog posts, you’ll notice a common theme: a strong emphasis on data science and predictive modeling. Linear Regression Nodes To begin, open KNIME Analytics Platform and open Analytics → Mining → Linear/Polynomial Regression within the Node Repository.
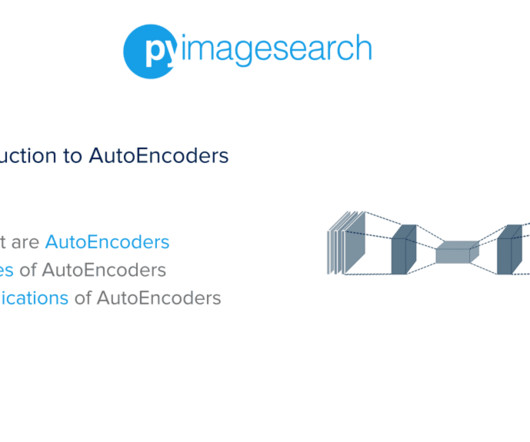
Figure 3: Latent space visualization of the closet (source: Kumar, “Autoencoder vs Variational Autoencoder (VAE): Differences,” Data Analytics , 2023 ). Feature Learning Autoencoders can learn meaningful features from input data, which can be used for downstream machine learning tasks like classification, clustering, or regression.
In the first part of our Anomaly Detection 101 series, we learned the fundamentals of Anomaly Detection and saw how spectral clustering can be used for credit card fraud detection. This method leverages data from various sensors and advanced analytics to monitor the condition of equipment in real-time. That’s not the case.
Here are the key steps to embark on the path towards becoming an AI Architect: Acquire a Strong Foundation Start by building a solid foundation in computerscience, mathematics, and statistics. Explore topics such as regression, classification, clustering, neural networks, and natural language processing.
Summary: Linear algebra underpins many analytical techniques in Data Science. Introduction Linear algebra for Data Science forms the backbone of many analytical and Machine Learning techniques. By grasping these basics, you will enhance your analytical skills and improve your ability to tackle complex data problems.
Training involved a dataset of over 15 trillion tokens across two GPU clusters, significantly more than Meta Llama 2. He focuses on generative AI, AI/ML, and Data Analytics. He holds a Bachelor’s in ComputerScience with a minor in Economics from Tufts University. Armando Diaz is a Solutions Architect at AWS.
We organize all of the trending information in your field so you don't have to. Join 17,000+ users and stay up to date on the latest articles your peers are reading.
You know about us, now we want to get to know you!
Let's personalize your content
Let's get even more personalized
We recognize your account from another site in our network, please click 'Send Email' below to continue with verifying your account and setting a password.


Let's personalize your content