This site uses cookies to improve your experience. To help us insure we adhere to various privacy regulations, please select your country/region of residence. If you do not select a country, we will assume you are from the United States. Select your Cookie Settings or view our Privacy Policy and Terms of Use.
Cookie Settings
Cookies and similar technologies are used on this website for proper function of the website, for tracking performance analytics and for marketing purposes. We and some of our third-party providers may use cookie data for various purposes. Please review the cookie settings below and choose your preference.
Used for the proper function of the website
Used for monitoring website traffic and interactions
Cookie Settings
Cookies and similar technologies are used on this website for proper function of the website, for tracking performance analytics and for marketing purposes. We and some of our third-party providers may use cookie data for various purposes. Please review the cookie settings below and choose your preference.
Strictly Necessary: Used for the proper function of the website
Performance/Analytics: Used for monitoring website traffic and interactions
The post Analyzing DecisionTree and K-means Clustering using Iris dataset. appeared first on Analytics Vidhya. ArticleVideo Book This article was published as a part of the Data Science Blogathon Introduction: As we all know, Artificial Intelligence is being widely.
DecisionTree 7. K Means Clustering Introduction We all know how Artificial Intelligence is leading nowadays. The post Machine Learning Algorithms appeared first on Analytics Vidhya. Simple Linear Regression 4. Multilinear Regression 5. Logistic Regression 6. Machine Learning […].
Entropy: These plots are critical in the field of decisiontrees and ensemble learning. They depict the impurity measures at different decision points. Suppose you’re building a decisiontree to classify customer feedback as positive or negative. The choice between the two depends on the specific use case.
It’s an integral part of data analytics and plays a crucial role in data science. Data analysis and interpretation After mining, the results are utilized for analytical modeling. Classification Classification techniques, including decisiontrees, categorize data into predefined classes.
Predictive modeling plays a crucial role in transforming vast amounts of data into actionable insights, paving the way for improved decision-making across industries. This powerful analytical tool not only enhances business operations but also drives innovation in various fields, from healthcare to finance. What is predictive modeling?
Key examples include Linear Regression for predicting prices, Logistic Regression for classification tasks, and DecisionTrees for decision-making. DecisionTrees visualize decision-making processes for better understanding. It iteratively assigns points to clusters and updates centroids until convergence.
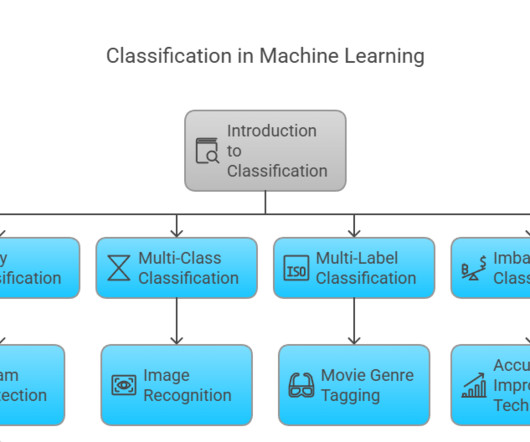
Summary: Classifier in Machine Learning involves categorizing data into predefined classes using algorithms like Logistic Regression and DecisionTrees. It’s crucial for applications like spam detection, disease diagnosis, and customer segmentation, improving decision-making and operational efficiency across various sectors.
They play a pivotal role in predictive analytics and machine learning, enabling data scientists to make informed forecasts and decisions based on historical data patterns. By leveraging models, data scientists can extrapolate trends and behaviors, facilitating proactive decision-making.
It identifies hidden patterns in data, making it useful for decision-making across industries. Compared to decisiontrees and SVM, it provides interpretable rules but can be computationally intensive. Key applications include fraud detection, customer segmentation, and medical diagnosis.
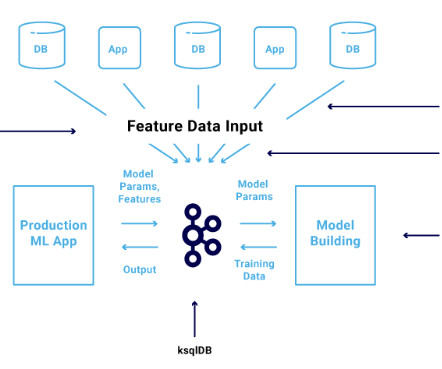
It is typically a single store of all enterprise data, including raw copies of source system data and transformed data used for tasks such as reporting, visualization, advanced analytics, and machine learning. All processing and machine-learning-related tasks are implemented in the analytics platform.
Skills gap : These strategies rely on data analytics, artificial intelligence tools, and machine learning expertise. Develop Hybrid Models Combine traditional analytical methods with modern algorithms such as decisiontrees, neural networks, and support vector machines. Here’s how one goes about this process.
Supervised learning is commonly used for risk assessment, image recognition, predictive analytics and fraud detection, and comprises several types of algorithms. Naïve Bayes algorithms include decisiontrees , which can actually accommodate both regression and classification algorithms. temperature, salary).
Predictive AI models enhance the speed and precision of predictive analytics and are typically used for business forecasting to project sales, estimate product or service demand, personalize customer experiences and optimize logistics. Decisiontrees implement a divide-and-conquer splitting strategy for optimal classification.
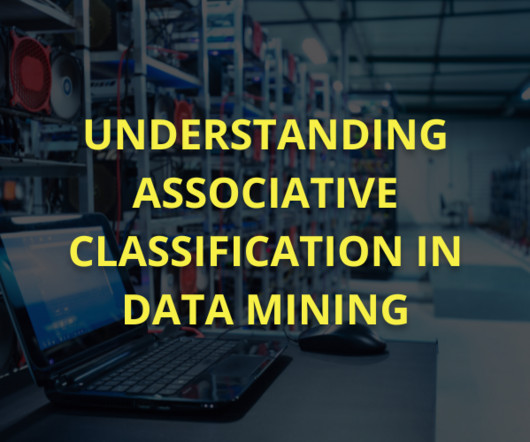
With such an overwhelming amount of data, data mining has become an essential process for businesses and organizations to extract valuable insights and make data-driven decisions. In data mining, popular algorithms include decisiontrees, support vector machines, and k-means clustering.
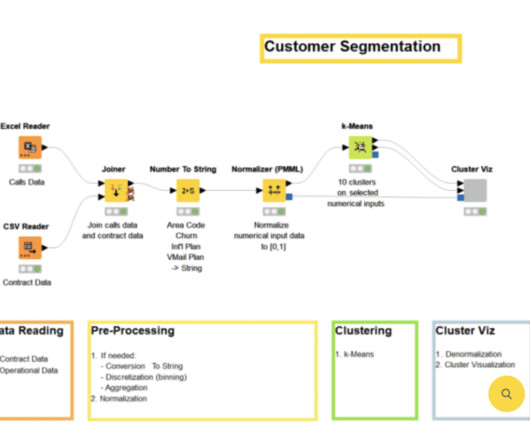
Delving further into KNIME Analytics Platform’s Node Repository reveals a treasure trove of data science-focused nodes, from linear regression to k-means clustering to ARIMA modeling—and quite a bit in between. Building a DecisionTree Model in KNIME The next predictive model that we want to talk about is the decisiontree.
These algorithms are carefully selected based on the specific decision problem and are trained using the prepared data. Machine learning algorithms, such as neural networks or decisiontrees, learn from the data to make predictions or generate recommendations.
Some of the common types are: Linear Regression Deep Neural Networks Logistic Regression DecisionTrees AI Linear Discriminant Analysis Naive Bayes Support Vector Machines Learning Vector Quantization K-nearest Neighbors Random Forest What do they mean? The information from previous decisions is analyzed via the decisiontree.
Some of the common types are: Linear Regression Deep Neural Networks Logistic Regression DecisionTrees AI Linear Discriminant Analysis Naive Bayes Support Vector Machines Learning Vector Quantization K-nearest Neighbors Random Forest What do they mean? The information from previous decisions is analyzed via the decisiontree.
Inclusion in Data Analytics certification courses highlights its importance in extracting knowledge from data. Enables decision-makers to navigate various industries confidently, fostering informed and strategic decision-making. Cluster Analysis It involves grouping similar data points based on certain characteristics.
Here’s a step-by-step guide on how to hire angularjs developers for performance optimization: Collecting performance data from an AngularJS application: Performance data can be collected using various tools, such as performance tracking tools like Google Analytics or user behavior analytics like Mixpanel.
Unsupervised classification and clustering. Decisiontree pruning and induction. Decision boundary learning with SVMs. Machine learning applications built with scikit-learn include financial cybersecurity analytics , product development, neuroimaging, barcode scanner development, and medical modeling.
On the other hand, artificial intelligence focuses on creating intelligent systems that can learn, reason, and make decisions. When AI and IoT converge, we witness a synergy where AI empowers IoT devices with advanced analytics, automation, and intelligent decision-making.
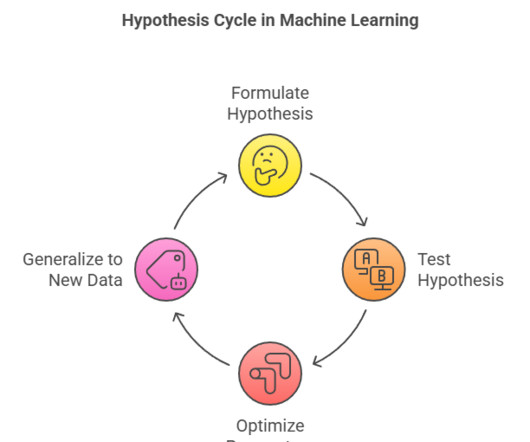
hypothesis form the foundation for diverse applications, from predictive analytics and recommendation engines to autonomous systems, enabling accurate, data-driven decision-making and improved model performance. DecisionTrees: Represent hypothesis as conditional rules. Decisiontrees examine various tree structures.
Algorithms in ML identify patterns and make decisions, which is crucial for applications like predictive analytics and recommendation systems. DecisionTreesDecisiontrees recursively partition data into subsets based on the most significant attribute values.
Techniques like linear regression, time series analysis, and decisiontrees are examples of predictive models. These models do not rely on predefined labels; instead, they discover the inherent structure in the data by identifying clusters based on similarities. Model selection requires balancing simplicity and performance.
It involves developing algorithms that can learn from and make predictions or decisions based on data. Familiarity with regression techniques, decisiontrees, clustering, neural networks, and other data-driven problem-solving methods is vital. Machine learning Machine learning is a key part of data science.
Moreover, you will also learn the use of clustering and dimensionality reduction algorithms. powered by TransOrg Analytics. As a part of this course, you will learn about programming languages like R, SVM, decisiontrees, random forests and other concepts of ML. The course is provided by Pickl.AI
Two such tools that have been making significant strides in this field are the KNIME Analytics Platform and the Snowflake Data Cloud. The integration capabilities of KNIME and the scalable data warehousing of Snowflake combine to offer a flexible and powerful platform for financial data analytics. What is KNIME & Snowflake?
Clustering and dimensionality reduction are common tasks in unSupervised Learning. For example, clustering algorithms can group customers by purchasing behaviour, even if the group labels are not predefined. Predictive analytics uses historical data to forecast future trends, such as stock market movements or customer churn.
It constructs multiple decisiontrees and combines their predictions to achieve accurate results in identifying different types of network traffic Support Vector Machines (SVM) : SVM is used for both classification and anomaly detection.
It also addresses security, privacy concerns, and real-world applications across various industries, preparing students for careers in data analytics and fostering a deep understanding of Big Data’s impact. Velocity It indicates the speed at which data is generated and processed, necessitating real-time analytics capabilities.
Clustering: An unsupervised Machine Learning technique that groups similar data points based on their inherent similarities. D Data Mining : The process of discovering patterns, insights, and knowledge from large datasets using various techniques such as classification, clustering, and association rule learning.
Key Takeaways Data-driven decisions enhance efficiency across various industries. Predictive analytics improves customer experiences in real-time. Together, Data Science and AI enable organisations to analyse vast amounts of data efficiently and make informed decisions based on predictive analytics.
Additionally, it delves into case study questions, advanced technical topics, and scenario-based queries, highlighting the skills and knowledge required for success in data analytics roles. Additionally, we’ve got your back if you consider enrolling in the best data analytics courses. What approach would you take?
Aspiring Data Scientists must equip themselves with a diverse skill set encompassing technical expertise, analytical prowess, and domain knowledge. Whether you’re venturing into machine learning, predictive analytics, or data visualization, honing the following top Data Science skills is essential for success.
Summary: Data Analysis focuses on extracting meaningful insights from raw data using statistical and analytical methods, while data visualization transforms these insights into visual formats like graphs and charts for better comprehension. Both complement each other to enhance decision-making processes.
Most winners and other competitive solutions had cross-validation scores clustered in the range from 8590 KAF, with 3rd place winner rasyidstat standing out with score of 79.5 Currently working in the IoT domain, focusing on elevating consumer experience and optimizing product reliability through data-driven insights and analytics.
Well-supported: Python has a large community of followers that includes professionals from the academic and industrial circles which allows them to use the analytics libraries for problem solving. Begin by employing algorithms for supervised learning such as linear regression , logistic regression, decisiontrees, and support vector machines.
Similarly, the Data and Analytics market is set to grow at a CAGR of 12.85% , reaching 15,313.99 They collect, clean, and analyse data to extract actionable insights that help organisations make informed decisions. More to read: How is Data Visualization helpful in Business Analytics? billion INR by 2026, with a CAGR of 27.7%.
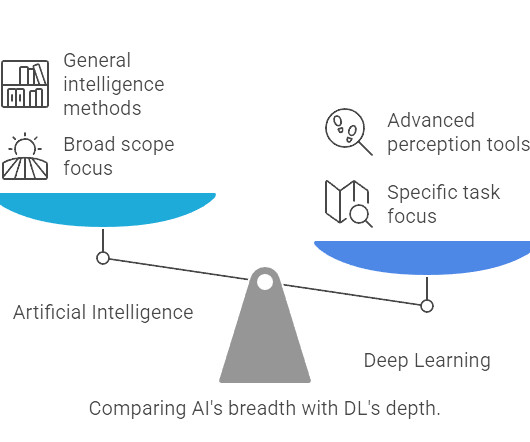
DL Enhances Predictive Analytics: Excels in image and speech recognition tasks. AI is a broad field focused on simulating human intelligence, encompassing techniques like decisiontrees and rule-based systems. Deep Learning Focuses on Neural Networks : Specializes in complex pattern recognition.
In the first part of our Anomaly Detection 101 series, we learned the fundamentals of Anomaly Detection and saw how spectral clustering can be used for credit card fraud detection. This method leverages data from various sensors and advanced analytics to monitor the condition of equipment in real-time.
Hence, you can use R for classification, clustering, statistical tests and linear and non-linear modelling. Packages like caret, random Forest, glmnet, and xgboost offer implementations of various machine learning algorithms, including classification, regression, clustering, and dimensionality reduction. How is R Used in Data Science?
What is the difference between data analytics and data science? Data analytics deals with checking the existing hypothesis and information and answering questions for a better and more effective business-related decision-making process. Decisiontrees are more prone to overfitting.
Its speed and performance make it a favored language for big data analytics, where efficiency and scalability are paramount. SAS: Analytics and Business Intelligence SAS is a leading programming language for analytics and business intelligence. A: SAS comes with analytical and business intelligence capabilities.
We organize all of the trending information in your field so you don't have to. Join 17,000+ users and stay up to date on the latest articles your peers are reading.
You know about us, now we want to get to know you!
Let's personalize your content
Let's get even more personalized
We recognize your account from another site in our network, please click 'Send Email' below to continue with verifying your account and setting a password.


Let's personalize your content