This site uses cookies to improve your experience. To help us insure we adhere to various privacy regulations, please select your country/region of residence. If you do not select a country, we will assume you are from the United States. Select your Cookie Settings or view our Privacy Policy and Terms of Use.
Cookie Settings
Cookies and similar technologies are used on this website for proper function of the website, for tracking performance analytics and for marketing purposes. We and some of our third-party providers may use cookie data for various purposes. Please review the cookie settings below and choose your preference.
Used for the proper function of the website
Used for monitoring website traffic and interactions
Cookie Settings
Cookies and similar technologies are used on this website for proper function of the website, for tracking performance analytics and for marketing purposes. We and some of our third-party providers may use cookie data for various purposes. Please review the cookie settings below and choose your preference.
Strictly Necessary: Used for the proper function of the website
Performance/Analytics: Used for monitoring website traffic and interactions
Connectivity is where the Tableau experience starts . Our mission at Tableau is to help customers see and understand their data. To accomplish this, customers need to be able to access whatever data is important to their analytic needs, wherever it lives. Now, with the Tableau 2021.2 Kristin Adderson.
It offers full BI-Stack Automation, from source to data warehouse through to frontend. It supports a holistic data model, allowing for rapid prototyping of various models. It also supports a wide range of data warehouses, analytical databases, datalakes, frontends, and pipelines/ETL.
In Tableau 2021.1, we’ve added new connectors to help our customers access more data in Azure than ever before: an Azure SQL Database connector and an Azure DataLake Storage Gen2 connector. As our customers increasingly adopt the cloud, we continue to make investments that ensure they can access their data anywhere.
EMEA Field CTO, Tableau. In many of the conversations we have with IT and business leaders, there is a sense of frustration about the speed of time-to-value for big data and data science projects. This inertia is stifling innovation and preventing data-driven decision-making to take root. . Francois Zimmermann.
Google BigQuery: Google BigQuery is a serverless, cloud-based data warehouse designed for big dataanalytics. It offers scalable storage and compute resources, enabling data engineers to process large datasets efficiently. It supports batch processing and is widely used for data-intensive tasks.
Product Marketing Specialist, Tableau. The newest release of Tableau is here! Tableau 2021.1 Upgrade to take advantage of these new innovations, and learn more about how Tableau brings AI into analytics to help users across your organization answer pressing questions. In Tableau 2021.1, In Tableau 2021.1,
Chief Product Officer, Tableau. At Dreamforce 2022 , Salesforce Co-CEOs Marc Benioff and Bret Taylor showed us an exciting vision of a connected, data-driven world in the face of rapid, global change. Data helps us innovate not only technology, but also customer experiences. Francois Ajenstat. Candice Vu. September 27, 2022.
Chief Product Officer, Tableau. At Dreamforce 2022 , Salesforce Co-CEOs Marc Benioff and Bret Taylor showed us an exciting vision of a connected, data-driven world in the face of rapid, global change. Data helps us innovate not only technology, but also customer experiences. Francois Ajenstat. Candice Vu. September 27, 2022.
Connectivity is where the Tableau experience starts. Our mission at Tableau is to help customers see and understand their data. To accomplish this, customers need to be able to access whatever data is important to their analytic needs, wherever it lives. Now, with the Tableau 2021.2 Kristin Adderson.
An interactive analytics application gives users the ability to run complex queries across complex data landscapes in real-time: thus, the basis of its appeal. Interactive analytics applications present vast volumes of unstructured data at scale to provide instant insights. Why Use an Interactive Analytics Application?
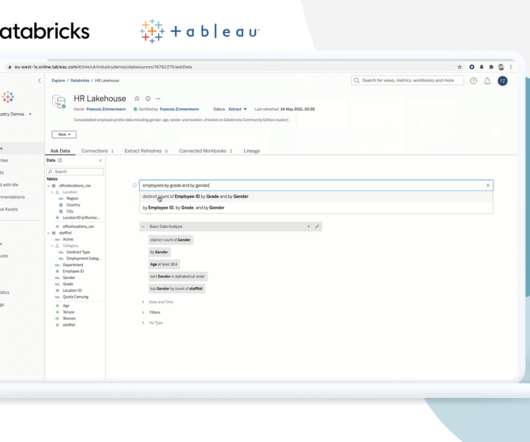
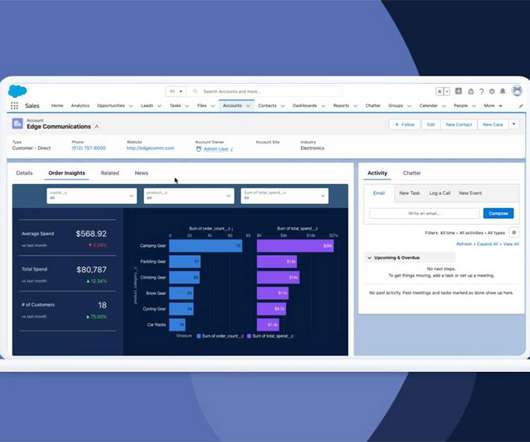
Senior Vice President, Product Marketing, Tableau. Every company today is being asked to do more with less, and leaders need access to fresh, trusted KPIs and data-driven insights to manage their businesses, keep ahead of the competition, and provide unparalleled customer experiences. . All your customer data is instantly accessible.
Senior Vice President, Product Marketing, Tableau. Every company today is being asked to do more with less, and leaders need access to fresh, trusted KPIs and data-driven insights to manage their businesses, keep ahead of the competition, and provide unparalleled customer experiences. . All your customer data is instantly accessible.
Architecturally the introduction of Hadoop, a file system designed to store massive amounts of data, radically affected the cost model of data. Organizationally the innovation of self-service analytics, pioneered by Tableau and Qlik, fundamentally transformed the user model for data analysis.
Vielfältige Unterstützung: Kompatibel mit verschiedenen Datenbankmanagementsystemen wie MS SQL Server und Azure Synapse Analytics. DataLakes: Unterstützt MS Azure Blob Storage. Frontends : Kompatibel mit Tools wie Power BI, Qlik Sense und Tableau.
In Tableau 2021.1, we’ve added new connectors to help our customers access more data in Azure than ever before: an Azure SQL Database connector and an Azure DataLake Storage Gen2 connector. As our customers increasingly adopt the cloud, we continue to make investments that ensure they can access their data anywhere.
Though you may encounter the terms “data science” and “dataanalytics” being used interchangeably in conversations or online, they refer to two distinctly different concepts. Meanwhile, dataanalytics is the act of examining datasets to extract value and find answers to specific questions.
EMEA Field CTO, Tableau. In many of the conversations we have with IT and business leaders, there is a sense of frustration about the speed of time-to-value for big data and data science projects. This inertia is stifling innovation and preventing data-driven decision-making to take root. . Francois Zimmermann.
Businesses meet their customer needs every day using Salesforce CDP and Tableau CRM (TCRM). Salesforce CDP creates holistic customer views by pulling data from internal and external databases and building unified customer profiles. Reduce password fatigue with a single sign-on to access Tableau CRM and Salesforce CDP.
Businesses meet their customer needs every day using Salesforce CDP and Tableau CRM (TCRM). Salesforce CDP creates holistic customer views by pulling data from internal and external databases and building unified customer profiles. Reduce password fatigue with a single sign-on to access Tableau CRM and Salesforce CDP.
Spencer Czapiewski Southard Jones Chief Product Officer, Tableau Since the announcement of Tableau Next (formerly Tableau Einstein), we've been thrilled by all the enthusiasm and curiosity from our community, customers, and partners. What is Tableau Next and why now?
Spencer Czapiewski October 8, 2024 - 9:14pm Southard Jones Chief Product Officer, Tableau Since the announcement of Tableau Einstein, we've been thrilled by all the enthusiasm and curiosity from our community, customers, and partners. What is Tableau Einstein and why now?
For many enterprises, a hybrid cloud datalake is no longer a trend, but becoming reality. Due to these needs, hybrid cloud datalakes emerged as a logical middle ground between the two consumption models. Without business context, business users are less likely to use the datalake and insights will be hard to come by.
VP, Product Management, Tableau. When you work in IT, you see first hand how the increasing business appetite for data stresses existing systems—and even in-flight digital transformations. Data fabric governance assumes a federated environment, so they scale by connecting to new data sources as they emerge. Volker Metten.
VP, Product Management, Tableau. When you work in IT, you see first hand how the increasing business appetite for data stresses existing systems—and even in-flight digital transformations. Data fabric governance assumes a federated environment, so they scale by connecting to new data sources as they emerge. Volker Metten.
Product Marketing Specialist, Tableau. The newest release of Tableau is here! Tableau 2021.1 Upgrade to take advantage of these new innovations, and learn more about how Tableau brings AI into analytics to help users across your organization answer pressing questions. In Tableau 2021.1, In Tableau 2021.1,
Senior Manager, Product Marketing, Tableau. By now, you’ve heard the good news: The business world is embracing data-driven decision making and growing their data practices at an unprecedented clip. At Tableau, we believe that the best decisions are made when everyone is empowered to put data at the center of every conversation.
Chief Product Officer, Tableau. At Dreamforce 2022 , Salesforce Co-CEOs Marc Benioff and Bret Taylor showed us an exciting vision of a connected, data-driven world in the face of rapid, global change. Data helps us innovate not only technology, but also customer experiences. Francois Ajenstat. Candice Vu. September 27, 2022.
Senior Manager, Product Marketing, Tableau. By now, you’ve heard the good news: The business world is embracing data-driven decision making and growing their data practices at an unprecedented clip. At Tableau, we believe that the best decisions are made when everyone is empowered to put data at the center of every conversation.
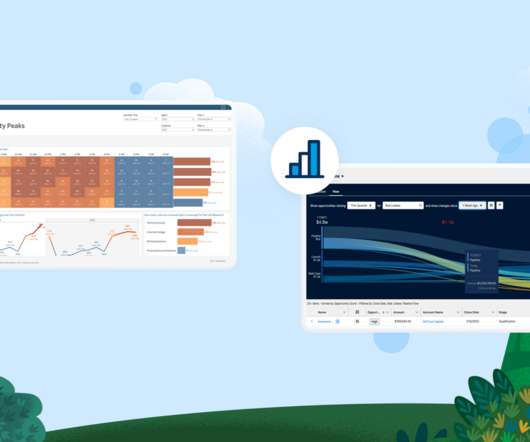
Allison (Ally) Witherspoon Johnston Senior Vice President, Product Marketing, Tableau Bronwen Boyd December 7, 2022 - 11:16pm February 14, 2023 In the quest to become a customer-focused company, the ability to quickly act on insights and deliver personalized customer experiences has never been more important. Up to date. Let’s explore how.
Cloud Computing , erst mit den Infrastructure as a Service (IaaS) Angeboten von Amazon, Microsoft und Google, wurde zum Enabler für schnelle, flexible Big Data Architekturen. 2 Denn heute spielt die Definition darüber, was Big Data eigentlich genau ist, wirklich keine Rolle mehr. Artificial Intelligence (AI) ersetzt.
Director of Research, Tableau. The data lakehouse is one such architecture—with “lake” from datalake and “house” from data warehouse. With these golden rules, data is everyone's business at Schneider Electric—not just an IT process. Check out our AI analytics solutions. Vidya Setlur.
As the sibling of data science, dataanalytics is still a hot field that garners significant interest. Companies have plenty of data at their disposal and are looking for people who can make sense of it and make deductions quickly and efficiently.
Director of Research, Tableau. The data lakehouse is one such architecture—with “lake” from datalake and “house” from data warehouse. With these golden rules, data is everyone's business at Schneider Electric—not just an IT process. Check out our AI analytics solutions. Vidya Setlur.
There are many well-known libraries and platforms for data analysis such as Pandas and Tableau, in addition to analytical databases like ClickHouse, MariaDB, Apache Druid, Apache Pinot, Google BigQuery, Amazon RedShift, etc. This includes its structure, content, and relationships between variables.
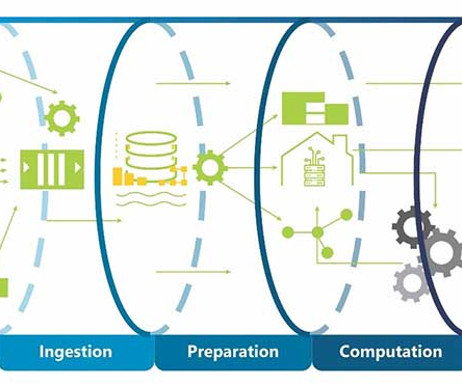
A traditional data pipeline is a structured process that begins with gathering data from various sources and loading it into a data warehouse or datalake. Once ingested, the data is prepared through filtering, error correction, and restructuring for ease of use.
Summary: Big Data encompasses vast amounts of structured and unstructured data from various sources. Key components include data storage solutions, processing frameworks, analytics tools, and governance practices. Key Takeaways Big Data originates from diverse sources, including IoT and social media.
Summary: Big Data encompasses vast amounts of structured and unstructured data from various sources. Key components include data storage solutions, processing frameworks, analytics tools, and governance practices. Key Takeaways Big Data originates from diverse sources, including IoT and social media.
Being able to discover connections between variables and to make quick insights will allow any practitioner to make the most out of the data. Analytics and Data Analysis Coming in as the 4th most sought-after skill is dataanalytics, as many data scientists will be expected to do some analysis in their careers.
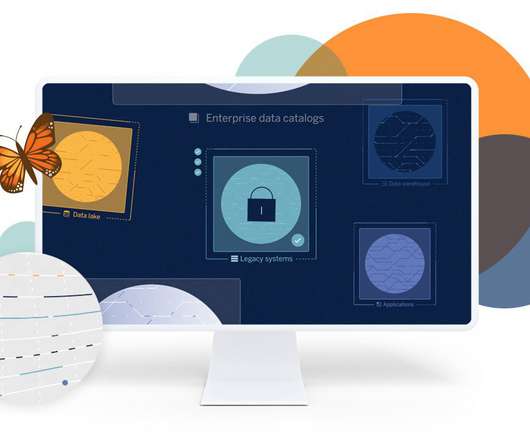
Organizations who are so successful in their adoption of self-service analytics, that their own business intelligence (BI) evangelists worry that they’ve created an analytics “wild west.” When they see a data catalog for the first time, they’re thrilled that a product exists that can govern the west and increase analyst productivity.
Tools like MicroStrategy and Tableau make it easy for business users to quickly turn raw data into visualizations and reports. But before you can even start, you have to find a relevant data set, understand it, and trust it. This top-down approach is highly governed and ensures consistency, but hinders analytical agility.
Salesforce Data Cloud and Einstein Model Builder Salesforce Data Cloud is a data platform that unifies your company’s data, giving every team a 360-degree view of the customer to drive automation and analytics, personalize engagement, and power trusted AI. Ravi Bhattiprolu is a Sr.
Research indicates that companies utilizing advanced analytics are 5 times more likely to make faster decisions than their competitors. Key Components of Business Intelligence Architecture Business Intelligence (BI) architecture is a structured framework that enables organizations to gather, analyze, and present data effectively.
.” Part of GoDaddy’s transformation was to get the right customer data consolidated in one place and make it accessible to every employee for data-driven decision making. This meant a large Hadoop deployment, self-service analytics tools available to every employee with Tableau, and a data catalog from Alation.
Summary: A comprehensive Big Data syllabus encompasses foundational concepts, essential technologies, data collection and storage methods, processing and analysis techniques, and visualisation strategies. Velocity It indicates the speed at which data is generated and processed, necessitating real-time analytics capabilities.
We organize all of the trending information in your field so you don't have to. Join 17,000+ users and stay up to date on the latest articles your peers are reading.
You know about us, now we want to get to know you!
Let's personalize your content
Let's get even more personalized
We recognize your account from another site in our network, please click 'Send Email' below to continue with verifying your account and setting a password.


Let's personalize your content