This site uses cookies to improve your experience. To help us insure we adhere to various privacy regulations, please select your country/region of residence. If you do not select a country, we will assume you are from the United States. Select your Cookie Settings or view our Privacy Policy and Terms of Use.
Cookie Settings
Cookies and similar technologies are used on this website for proper function of the website, for tracking performance analytics and for marketing purposes. We and some of our third-party providers may use cookie data for various purposes. Please review the cookie settings below and choose your preference.
Used for the proper function of the website
Used for monitoring website traffic and interactions
Cookie Settings
Cookies and similar technologies are used on this website for proper function of the website, for tracking performance analytics and for marketing purposes. We and some of our third-party providers may use cookie data for various purposes. Please review the cookie settings below and choose your preference.
Strictly Necessary: Used for the proper function of the website
Performance/Analytics: Used for monitoring website traffic and interactions
Chief Product Officer, Tableau. It's more important than ever in this all digital, work from anywhere world for organizations to use data to make informed decisions. However, most organizations struggle to become data driven. With Tableau, any user can visually explore that data in real time. Francois Ajenstat.
This technology sprawl often creates data silos and presents challenges to ensuring that organizations can effectively enforce data governance while still providing trusted, real-time insights to the business. Tableau Pulse: Tableau Pulse metrics can be directly connected to dbt models and metrics.
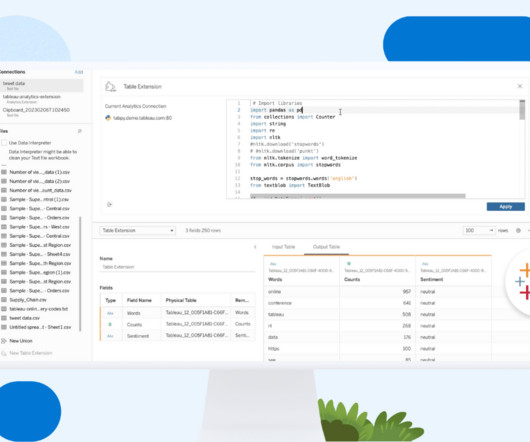
Swetha Bezawada Senior Data Scientist Colten Woo September 26, 2023 - 6:57pm October 2, 2023 The typical analytical ecosystem has two silos: business intelligence and data science. Data scientists have a wide range of options to choose from when it comes to programming languages and platforms to build their predictive models.
Spencer Czapiewski September 12, 2024 - 8:38pm Karen Madera Senior Manager, Product Marketing, Tableau We’re in the midst of an autonomous revolution that’s reshaping the way businesses use data to gain a competitive edge, delight customers, and engage employees. Some just want answers delivered to them in the context of their work.
There’s a lot to take in at Tableau Conference. Here are our staff recommendations for must-see sessions at Tableau Conference 2022, broken out by themes (more on this below) and format (in person or virtual). . You’ll also find sessions on Tableau Prep , Virtual Connections, Salesforce Data Connectivity, and more.
It offers full BI-Stack Automation, from source to data warehouse through to frontend. It supports a holistic datamodel, allowing for rapid prototyping of various models. It also supports a wide range of data warehouses, analytical databases, data lakes, frontends, and pipelines/ETL.
Chief Product Officer, Tableau. It's more important than ever in this all digital, work from anywhere world for organizations to use data to make informed decisions. However, most organizations struggle to become data driven. With Tableau, any user can visually explore that data in real time. Francois Ajenstat.
Swetha Bezawada Senior Data Scientist Colten Woo September 26, 2023 - 6:57pm October 2, 2023 The typical analytical ecosystem has two silos: business intelligence and data science. Data scientists have a wide range of options to choose from when it comes to programming languages and platforms to build their predictive models.
This week, Gartner published the 2021 Magic Quadrant for Analytics and Business Intelligence Platforms. Gartner has again recognized Tableau as a Leader—for our ninth consecutive year. . I first want to thank you, the Tableau Community, for your continued support and your commitment to data, to Tableau, and to each other.
Skills and Training Familiarity with ethical frameworks like the IEEE’s Ethically Aligned Design, combined with strong analytical and compliance skills, is essential. Strong analytical skills and the ability to work with large datasets are critical, as is familiarity with datamodeling and ETL processes.
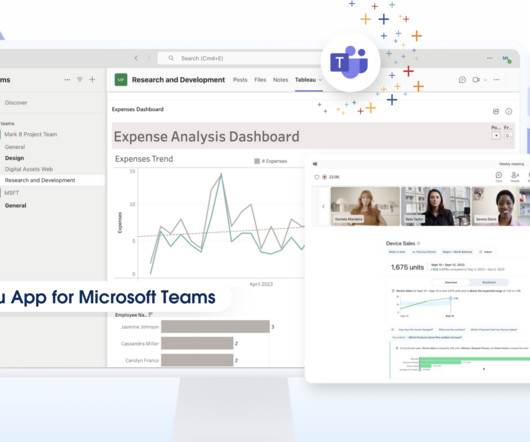
Spencer Czapiewski September 11, 2024 - 7:45pm Madeline Lee Product Manager, Technology Partners Empowering teams to make data-driven decisions quickly and collaboratively is no longer optional—it's necessary for business success. While many of our customers use Tableau alongside Microsoft Teams, these workflows have been disconnected.
Ateken Abla March 19, 2024 - 9:05pm Larissa Amoroso Vice President, Tableau Community, Tableau When Karolina Grodzinska took the stage at Tableau Conference as part of her Iron Viz: Student Edition award, it felt like the culmination of her data learning, which started in 2021. How did Karolina discover Tableau? “It
Spencer Czapiewski August 29, 2024 - 9:52pm Kirk Munroe Chief Analytics Officer & Founding Partner at Paint with Data Kirk Munroe, Chief Analytics Officer and Founding Partner at Paint with Data and Tableau DataDev Ambassador, explains the value of using relationships in your Tableaudatamodels.
There’s a lot to take in at Tableau Conference. Here are our staff recommendations for must-see sessions at Tableau Conference 2022, broken out by themes (more on this below) and format (in person or virtual). . You’ll also find sessions on Tableau Prep , Virtual Connections, Salesforce Data Connectivity, and more.
New big data architectures and, above all, data sharing concepts such as Data Mesh are ideal for creating a common database for many data products and applications. The Event Log DataModel for Process Mining Process Mining as an analytical system can very well be imagined as an iceberg.
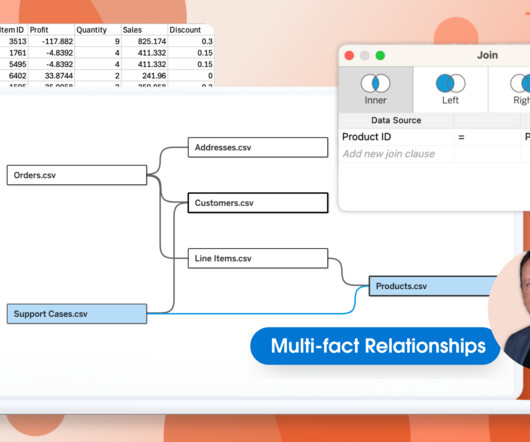
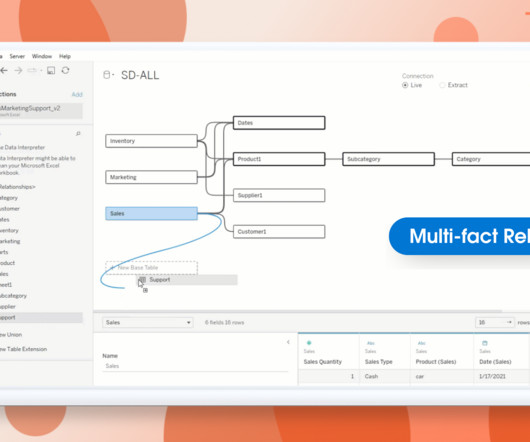
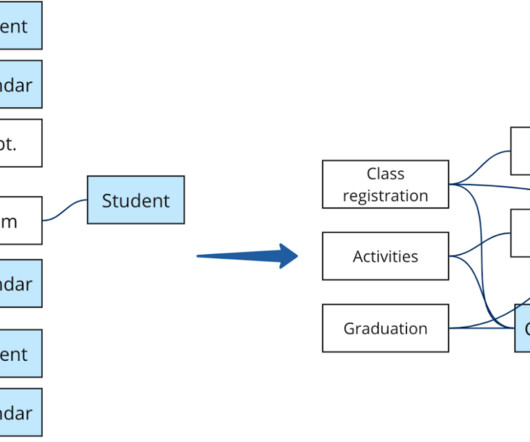
Spencer Czapiewski July 25, 2024 - 5:54pm Thomas Nhan Director, Product Management, Tableau Lari McEdward Technical Writer, Tableau Expand your datamodeling and analysis with Multi-fact Relationships, available with Tableau 2024.2. What is Multi-fact Relationships in Tableau?
Google BigQuery: Google BigQuery is a serverless, cloud-based data warehouse designed for big dataanalytics. It offers scalable storage and compute resources, enabling data engineers to process large datasets efficiently. It supports batch processing and is widely used for data-intensive tasks.
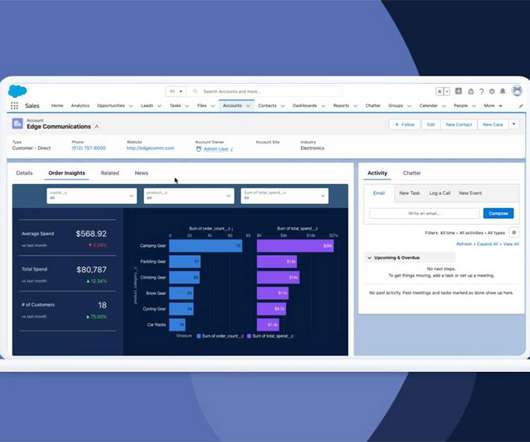
Senior Vice President, Product Marketing, Tableau. Every company today is being asked to do more with less, and leaders need access to fresh, trusted KPIs and data-driven insights to manage their businesses, keep ahead of the competition, and provide unparalleled customer experiences. . All your customer data is instantly accessible.
Senior Vice President, Product Marketing, Tableau. Every company today is being asked to do more with less, and leaders need access to fresh, trusted KPIs and data-driven insights to manage their businesses, keep ahead of the competition, and provide unparalleled customer experiences. . All your customer data is instantly accessible.
Hopefully, at the top, because it’s the very foundation of self-service analytics. We’re all trying to use more data to make decisions, but constantly face roadblocks and trust issues related to data governance. . We’ll share how we’re doing this internally at Tableau, focusing on three key areas of understanding and action.
While the front-end report visuals are important and the most visible to end users, a lot goes on behind the scenes that contribute heavily to the end product, including datamodeling. In this blog, we’ll describe datamodeling and its significance in Power BI. What is DataModeling?
Hopefully, at the top, because it’s the very foundation of self-service analytics. We’re all trying to use more data to make decisions, but constantly face roadblocks and trust issues related to data governance. . We’ll share how we’re doing this internally at Tableau, focusing on three key areas of understanding and action.
Danika Harrod December 20, 2024 - 10:44pm Dan Jewett Senior Vice President of Product Management As 2024 draws to a close, we want to express our heartfelt gratitude to the incredible Tableau Community. Its your feedback and collaboration that help us push the boundaries of whats possible in data visualization and analytics.
Though you may encounter the terms “data science” and “dataanalytics” being used interchangeably in conversations or online, they refer to two distinctly different concepts. Meanwhile, dataanalytics is the act of examining datasets to extract value and find answers to specific questions.
Spencer Czapiewski Southard Jones Chief Product Officer, Tableau Since the announcement of Tableau Next (formerly Tableau Einstein), we've been thrilled by all the enthusiasm and curiosity from our community, customers, and partners. What is Tableau Next and why now?
Spencer Czapiewski October 8, 2024 - 9:14pm Southard Jones Chief Product Officer, Tableau Since the announcement of Tableau Einstein, we've been thrilled by all the enthusiasm and curiosity from our community, customers, and partners. What is Tableau Einstein and why now?
This week, Gartner published the 2021 Magic Quadrant for Analytics and Business Intelligence Platforms. Gartner has again recognized Tableau as a Leader—for our ninth consecutive year. . I first want to thank you, the Tableau Community, for your continued support and your commitment to data, to Tableau, and to each other.
Summary: Struggling to translate data into clear stories? Tableau can help! This data visualization tool empowers Data Analysts with drag-and-drop simplicity, interactive dashboards, and a wide range of visualizations. What are The Benefits of Learning Tableau for Data Analysts?
Businesses meet their customer needs every day using Salesforce CDP and Tableau CRM (TCRM). Salesforce CDP creates holistic customer views by pulling data from internal and external databases and building unified customer profiles. Reduce password fatigue with a single sign-on to access Tableau CRM and Salesforce CDP.
Businesses meet their customer needs every day using Salesforce CDP and Tableau CRM (TCRM). Salesforce CDP creates holistic customer views by pulling data from internal and external databases and building unified customer profiles. Reduce password fatigue with a single sign-on to access Tableau CRM and Salesforce CDP.
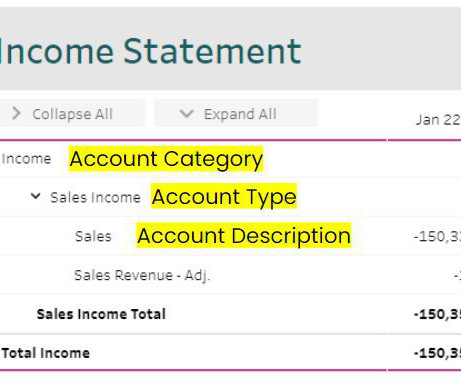
Income Statement Tableau Dashboard Example Megan Menth March 30, 2023 View Dashboard in Tableau Public This Tableau income statement dashboard gives users the traditional spreadsheet type of view into accounts, while also allowing for increased flexibility and dynamism. Who is This Dashboard For?
Advancement in big data technology has made the world of business even more competitive. The proper use of business intelligence and analyticaldata is what drives big brands in a competitive market. This is a self-service analytical platform for business users. It comes with embedded dashboards privately and publicly.
How to Optimize Power BI and Snowflake for Advanced Analytics Spencer Baucke May 25, 2023 The world of business intelligence and data modernization has never been more competitive than it is today. Much of what is discussed in this guide will assume some level of analytics strategy has been considered and/or defined. No problem!
VP, Product Management, Tableau. When you work in IT, you see first hand how the increasing business appetite for data stresses existing systems—and even in-flight digital transformations. Data fabric governance assumes a federated environment, so they scale by connecting to new data sources as they emerge. Volker Metten.
VP, Product Management, Tableau. When you work in IT, you see first hand how the increasing business appetite for data stresses existing systems—and even in-flight digital transformations. Data fabric governance assumes a federated environment, so they scale by connecting to new data sources as they emerge. Volker Metten.
Tableau is a data visualisation software helping you to generate graphics-rich reporting and analysing enormous volumes of data. With the help of Tableau, organisations have been able to mine and gather actionable insights from granular sources of data. Let’s read the blog to find out!
By presenting data visually, organisations can communicate insights more clearly and drive strategic decisions based on real-time analytics. Reveals hidden patterns and trends within large volumes of data. Supports predictive analytics to anticipate market trends and behaviours.
Senior Manager, Product Marketing, Tableau. By now, you’ve heard the good news: The business world is embracing data-driven decision making and growing their data practices at an unprecedented clip. At Tableau, we believe that the best decisions are made when everyone is empowered to put data at the center of every conversation.
Allison (Ally) Witherspoon Johnston Senior Vice President, Product Marketing, Tableau Bronwen Boyd December 7, 2022 - 11:16pm February 14, 2023 In the quest to become a customer-focused company, the ability to quickly act on insights and deliver personalized customer experiences has never been more important. Up to date. Let’s explore how.
Summary: Tableau is fantastic for data visualization, but understanding your data is key. Data types in Tableau act like labels, telling Tableau if it’s a number for calculations, text for labels, or a date for trends. Tableau recognizes numbers, dates, text, locations, and more.
Senior Manager, Product Marketing, Tableau. By now, you’ve heard the good news: The business world is embracing data-driven decision making and growing their data practices at an unprecedented clip. At Tableau, we believe that the best decisions are made when everyone is empowered to put data at the center of every conversation.
Vice President, Product, Tableau. Did you know 80% of data-driven businesses said they gained a critical advantage during the pandemic? Having complete, accurate data in all employees’ hands and workstreams helps organizations solve business problems with the customer journey in mind—especially in rapidly changing markets.
Vice President, Product, Tableau. Did you know 80% of data-driven businesses said they gained a critical advantage during the pandemic? Having complete, accurate data in all employees’ hands and workstreams helps organizations solve business problems with the customer journey in mind—especially in rapidly changing markets.
The current BI trends show that in the future, the BI software will be more accessible, so that even non-techie workers will rely on data insights in their working routine. Prescriptive Analytics. Automation & Augmented Analytics. This shows why self-service BI is on the rise. SAP Lumira.
We organize all of the trending information in your field so you don't have to. Join 17,000+ users and stay up to date on the latest articles your peers are reading.
You know about us, now we want to get to know you!
Let's personalize your content
Let's get even more personalized
We recognize your account from another site in our network, please click 'Send Email' below to continue with verifying your account and setting a password.


Let's personalize your content