This site uses cookies to improve your experience. To help us insure we adhere to various privacy regulations, please select your country/region of residence. If you do not select a country, we will assume you are from the United States. Select your Cookie Settings or view our Privacy Policy and Terms of Use.
Cookie Settings
Cookies and similar technologies are used on this website for proper function of the website, for tracking performance analytics and for marketing purposes. We and some of our third-party providers may use cookie data for various purposes. Please review the cookie settings below and choose your preference.
Used for the proper function of the website
Used for monitoring website traffic and interactions
Cookie Settings
Cookies and similar technologies are used on this website for proper function of the website, for tracking performance analytics and for marketing purposes. We and some of our third-party providers may use cookie data for various purposes. Please review the cookie settings below and choose your preference.
Strictly Necessary: Used for the proper function of the website
Performance/Analytics: Used for monitoring website traffic and interactions
Businesses need to understand the trends in datapreparation to adapt and succeed. If you input poor-quality data into an AI system, the results will be poor. This principle highlights the need for careful datapreparation, ensuring that the input data is accurate, consistent, and relevant.
Predictive analytics, sometimes referred to as big dataanalytics, relies on aspects of data mining as well as algorithms to develop predictive models. These predictive models can be used by enterprise marketers to more effectively develop predictions of future user behaviors based on the sourced historical data.
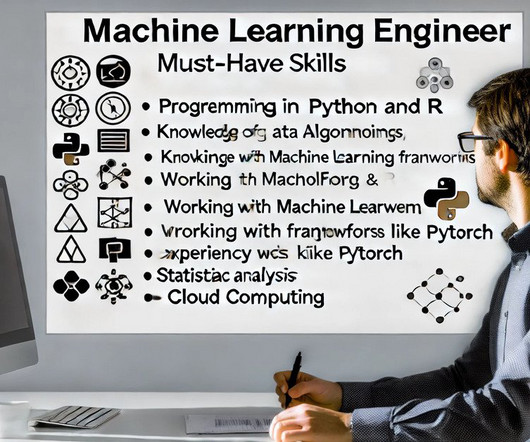
These skills include programming languages such as Python and R, statistics and probability, machine learning, data visualization, and datamodeling. Preparedata for effective analysis One important data scientist skill is preparingdata for effective analysis.
This week, Gartner published the 2021 Magic Quadrant for Analytics and Business Intelligence Platforms. I first want to thank you, the Tableau Community, for your continued support and your commitment to data, to Tableau, and to each other. Accelerate adoption with intuitive analytics that people love to use. Francois Ajenstat.
Hopefully, at the top, because it’s the very foundation of self-service analytics. We’re all trying to use more data to make decisions, but constantly face roadblocks and trust issues related to data governance. . Datamodeling. Data migration . Data architecture. Metadata management.
Defining Power BI Power BI provides a suite of data visualization and analysis tools to help organizations turn data into actionable insights. It allows users to connect to a variety of data sources, perform datapreparation and transformations, create interactive visualizations, and share insights with others.
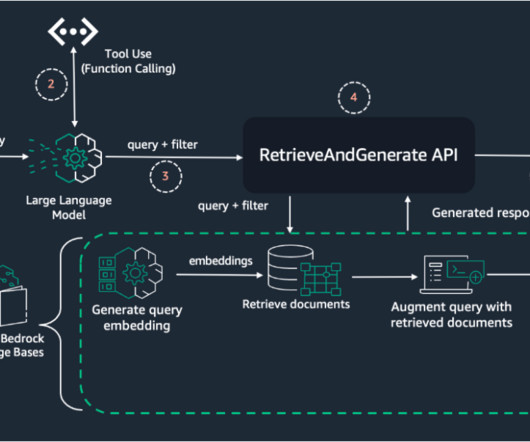
By combining the capabilities of LLM function calling and Pydantic datamodels, you can dynamically extract metadata from user queries. Knowledge base – You need a knowledge base created in Amazon Bedrock with ingested data and metadata.
Hopefully, at the top, because it’s the very foundation of self-service analytics. We’re all trying to use more data to make decisions, but constantly face roadblocks and trust issues related to data governance. . Datamodeling. Data migration . Data architecture. Metadata management.
Instead of centralizing data stores, data fabrics establish a federated environment and use artificial intelligence and metadata automation to intelligently secure data management. . At Tableau, we believe that the best decisions are made when everyone is empowered to put data at the center of every conversation.
If you’re currently using traditional AI, advanced analytics, and intelligent automation, aren’t you already getting deep insights into asset performance? Enterprise applications serve as repositories for extensive datamodels, encompassing historical and operational data in diverse databases. Undoubtedly.
Instead of centralizing data stores, data fabrics establish a federated environment and use artificial intelligence and metadata automation to intelligently secure data management. . At Tableau, we believe that the best decisions are made when everyone is empowered to put data at the center of every conversation.
This feature helps automate many parts of the datapreparation and datamodel development process. This significantly reduces the amount of time needed to engage in data science tasks. A text analytics interface that helps derive actionable insights from unstructured data sets.
This week, Gartner published the 2021 Magic Quadrant for Analytics and Business Intelligence Platforms. I first want to thank you, the Tableau Community, for your continued support and your commitment to data, to Tableau, and to each other. Accelerate adoption with intuitive analytics that people love to use. Francois Ajenstat.
The Datamarts capability opens endless possibilities for organizations to achieve their dataanalytics goals on the Power BI platform. They all agree that a Datamart is a subject-oriented subset of a data warehouse focusing on a particular business unit, department, subject area, or business functionality. What is a Datamart?
I proudly represented Team Tableau at the virtual BI Bake-Off to face off against other analytics platforms. Check out our five #TableauTips on how we used data storytelling, machine learning, natural language processing, and more to show off the power of the Tableau platform. . Use Tableau Prep to quickly combine and clean data .
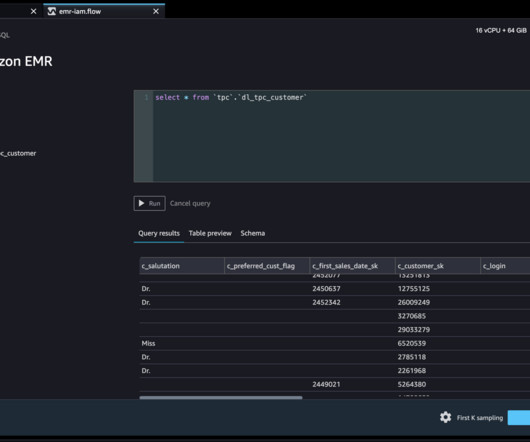
Amazon SageMaker Data Wrangler reduces the time it takes to collect and preparedata for machine learning (ML) from weeks to minutes. We are happy to announce that SageMaker Data Wrangler now supports using Lake Formation with Amazon EMR to provide this fine-grained data access restriction.
Summary: Power BI is a leading dataanalytics platform offering advanced features like real-time analytics and collaborative capabilities. With its intuitive interface, Power BI empowers users to connect to various data sources, create interactive reports, and share insights effortlessly.
The importance of SQL for Data Analysts is identified within organisations for understanding complex datasets and managing large volumes of data. The starting range for a SQL Data Analyst is $61,128 per annum. How SQL Important in DataAnalytics?
ODSC West 2024 showcased a wide range of talks and workshops from leading data science, AI, and machine learning experts. This blog highlights some of the most impactful AI slides from the world’s best data science instructors, focusing on cutting-edge advancements in AI, datamodeling, and deployment strategies.
Summary: The fundamentals of Data Engineering encompass essential practices like datamodelling, warehousing, pipelines, and integration. Understanding these concepts enables professionals to build robust systems that facilitate effective data management and insightful analysis. What is Data Engineering?
Summary: Power BI alternatives like Tableau, Qlik Sense, and Zoho Analytics provide businesses with tailored Data Analysis and Visualisation solutions. Selecting the right alternative ensures efficient data-driven decision-making and aligns with your organisation’s goals and budget.
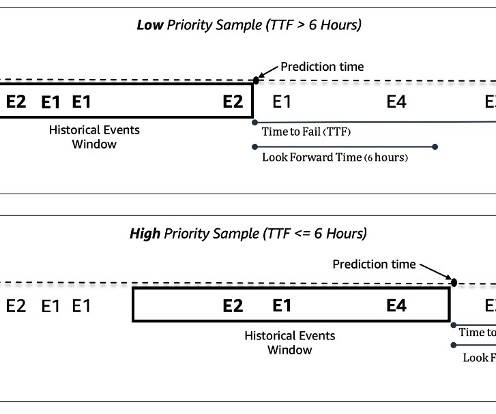
New machines are added continuously to the system, so we had to make sure our model can handle prediction on new machines that have never been seen in training. Data preprocessing and feature engineering In this section, we discuss our methods for datapreparation and feature engineering.
I proudly represented Team Tableau at the virtual BI Bake-Off to face off against other analytics platforms. Check out our five #TableauTips on how we used data storytelling, machine learning, natural language processing, and more to show off the power of the Tableau platform. . Use Tableau Prep to quickly combine and clean data .
Who This Book Is For This book is for practitioners in charge of building, managing, maintaining, and operationalizing the ML process end to end: Data science / AI / ML leaders: Heads of Data Science, VPs of Advanced Analytics, AI Lead etc. Exploratory data analysis (EDA) and modeling.
The process typically involves several key steps: Model Selection: Users choose from a library of pre-trained models tailored for specific applications such as Natural Language Processing (NLP), image recognition, or predictive analytics. Computer Vision : Models for image recognition, object detection, and video analytics.
Under this category, tools with pre-built connectors for popular data sources and visual tools for data transformation are better choices. Integration: How well does the tool integrate with your existing infrastructure, databases, cloud platforms, and analytics tools? Another way is to add the Snowflake details through Fivetran.
These questions are designed to assess your proficiency in Excel’s complex features, enabling you to demonstrate your analytical skills and problem-solving abilities effectively during interviews. What is the difference between VLOOKUP and INDEX/MATCH? Can you explain what macros are in Excel?
Data Collection The process begins with the collection of relevant and diverse data from various sources. This can include structured data (e.g., databases, spreadsheets) as well as unstructured data (e.g., DataPreparation Once collected, the data needs to be preprocessed and prepared for analysis.
Concise data summaries are provided by ChatGPT, which helps with high-level comprehension. If you want to learn more in-depth knowledge about DataAnalytics and work with industry experts, then click here to learn more. ChatGPT Data Analysis Plugin Plugins of ChatGPT increase its functionality.
Model Evaluation and Tuning After building a Machine Learning model, it is crucial to evaluate its performance to ensure it generalises well to new, unseen data. Model evaluation and tuning involve several techniques to assess and optimise model accuracy and reliability.
For instance, science data that requires an indefinite number of analytical iterations can be processed much faster with the help of patterns automated by machine learning. Data gathering and exploration — continuing with thorough preparation, specific data types to be analyzed and processed must be settled.
You need to make that model available to the end users, monitor it, and retrain it for better performance if needed. Microsoft Azure ML Provided by Microsoft , Azure Machine Learning (ML) is a cloud-based machine learning platform that enables data scientists and developers to build, train, and deploy machine learning models at scale.
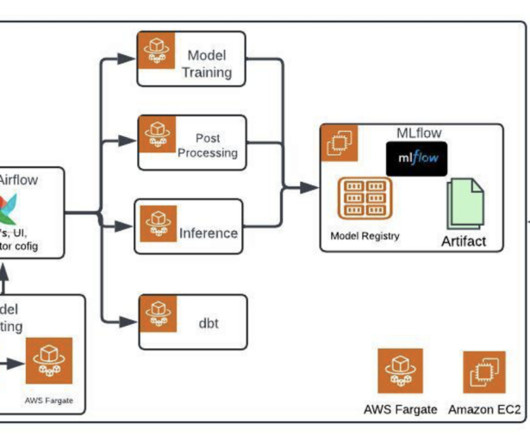
See also Thoughtworks’s guide to Evaluating MLOps Platforms End-to-end MLOps platforms End-to-end MLOps platforms provide a unified ecosystem that streamlines the entire ML workflow, from datapreparation and model development to deployment and monitoring. A self-service infrastructure portal for infrastructure and governance.
Information – data that’s processed, organized, and consumable – drives insights that lead to actions and value generation. This article shares my experience in dataanalytics and digital tool implementation, focusing on leveraging “Big Data” to create actionable insights.
introduces a wide range of capabilities designed to improve every stage of data analysis—from datapreparation to dashboard consumption. Tableau workbook performance can have a huge effect on the analytics experience for individuals, plus there are implications for your organization at the technology level. Tableau 2022.1
introduces a wide range of capabilities designed to improve every stage of data analysis—from datapreparation to dashboard consumption. Tableau workbook performance can have a huge effect on the analytics experience for individuals, plus there are implications for your organization at the technology level. Tableau 2022.1
ZOE is a multi-agent LLM application that integrates with multiple data sources to provide a unified view of the customer, simplify analytics queries, and facilitate marketing campaign creation. Additionally, Feast promotes feature reuse, so the time spent on datapreparation is reduced greatly.
Summary: This blog dives into the most promising Power BI projects, exploring advanced data visualization, AI integration, IoT & blockchain analytics, and emerging technologies. Discover best practices for successful implementation and propel your organization towards data-driven success.
ML development – This phase of the ML lifecycle should be hosted in an isolated environment for model experimentation and building the candidate model. Several activities are performed in this phase, such as creating the model, datapreparation, model training, evaluation, and model registration.
We organize all of the trending information in your field so you don't have to. Join 17,000+ users and stay up to date on the latest articles your peers are reading.
You know about us, now we want to get to know you!
Let's personalize your content
Let's get even more personalized
We recognize your account from another site in our network, please click 'Send Email' below to continue with verifying your account and setting a password.


Let's personalize your content