This site uses cookies to improve your experience. To help us insure we adhere to various privacy regulations, please select your country/region of residence. If you do not select a country, we will assume you are from the United States. Select your Cookie Settings or view our Privacy Policy and Terms of Use.
Cookie Settings
Cookies and similar technologies are used on this website for proper function of the website, for tracking performance analytics and for marketing purposes. We and some of our third-party providers may use cookie data for various purposes. Please review the cookie settings below and choose your preference.
Used for the proper function of the website
Used for monitoring website traffic and interactions
Cookie Settings
Cookies and similar technologies are used on this website for proper function of the website, for tracking performance analytics and for marketing purposes. We and some of our third-party providers may use cookie data for various purposes. Please review the cookie settings below and choose your preference.
Strictly Necessary: Used for the proper function of the website
Performance/Analytics: Used for monitoring website traffic and interactions
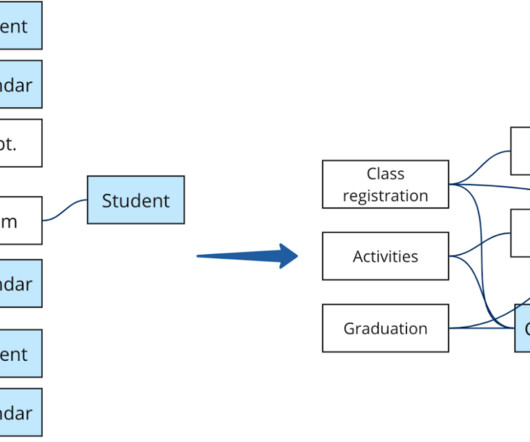
Introduction This article will introduce the concept of datamodeling, a crucial process that outlines how data is stored, organized, and accessed within a database or data system. It involves converting real-world business needs into a logical and structured format that can be realized in a database or data warehouse.
Summary: Big Datavisualization involves representing large datasets graphically to reveal patterns, trends, and insights that are not easily discernible from raw data. quintillion bytes of data daily, the need for effective visualization techniques has never been greater. As we generate approximately 2.5
As the volume and complexity of data continue to surge, the demand for skilled professionals who can derive meaningful insights from this wealth of information has skyrocketed. Top 10 Professions in Data Science: Below, we provide a list of the top data science careers along with their corresponding salary ranges: 1.
The modern corporate world is more data-driven, and companies are always looking for new methods to make use of the vast data at their disposal. Cloud analytics is one example of a new technology that has changed the game. What is cloud analytics? How does cloud analytics work?
Skills and Training Familiarity with ethical frameworks like the IEEE’s Ethically Aligned Design, combined with strong analytical and compliance skills, is essential. Strong analytical skills and the ability to work with large datasets are critical, as is familiarity with datamodeling and ETL processes.
These skills include programming languages such as Python and R, statistics and probability, machine learning, datavisualization, and datamodeling. Prepare data for effective analysis One important data scientist skill is preparing data for effective analysis.
Data is an essential component of any business, and it is the role of a data analyst to make sense of it all. Power BI is a powerful datavisualization tool that helps them turn raw data into meaningful insights and actionable decisions. Check out this course and learn Power BI today!
However, most organizations struggle to become data driven. Data is stuck in siloes, infrastructure can’t scale to meet growing data needs, and analytics is still too hard for most people to use. Google's Cloud Platform is the enterprise solution of choice for many organizations with large and complex data problems.
Data engineering tools offer a range of features and functionalities, including data integration, data transformation, data quality management, workflow orchestration, and datavisualization. Essential data engineering tools for 2023 Top 10 data engineering tools to watch out for in 2023 1.
According to Forbes, Almost eighty-thousand scientific studies attest that visual images promote retention. Research has shown that many people learn best when they see a story or information depicted in an image.
Though you may encounter the terms “data science” and “dataanalytics” being used interchangeably in conversations or online, they refer to two distinctly different concepts. Meanwhile, dataanalytics is the act of examining datasets to extract value and find answers to specific questions.
GPTs for Data science are the next step towards innovation in various data-related tasks. These are platforms that integrate the field of dataanalytics with artificial intelligence (AI) and machine learning (ML) solutions. Moreover, they can uncover new data insights and correlations that can go unnoticed otherwise.
However, most organizations struggle to become data driven. Data is stuck in siloes, infrastructure can’t scale to meet growing data needs, and analytics is still too hard for most people to use. Google's Cloud Platform is the enterprise solution of choice for many organizations with large and complex data problems.
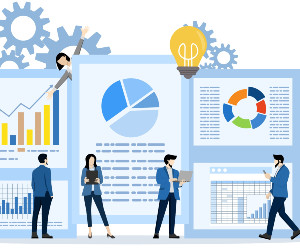
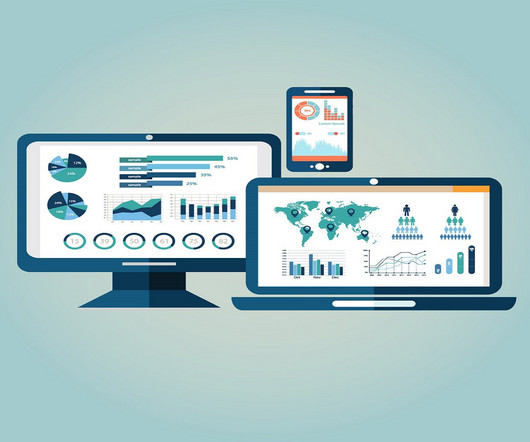
In the digital era, datavisualization stands as an indispensable tool in the realm of business intelligence. It represents the graphical display of data and information, transforming complex datasets into intuitive and understandable visuals. What does the data say? What relevant factor is missing?
This week, Gartner published the 2021 Magic Quadrant for Analytics and Business Intelligence Platforms. I first want to thank you, the Tableau Community, for your continued support and your commitment to data, to Tableau, and to each other. Accelerate adoption with intuitive analytics that people love to use. Francois Ajenstat.
How to Optimize Power BI and Snowflake for Advanced Analytics Spencer Baucke May 25, 2023 The world of business intelligence and data modernization has never been more competitive than it is today. Much of what is discussed in this guide will assume some level of analytics strategy has been considered and/or defined. No problem!
Countless hours vizzing, a standout Tableau Public profile , and a graduate degree later, Karolina reflects on her data journey and what led her to her current role as a Business Intelligence Analyst at Schneider Electric. I already had some interest in datavisualization, I just didn't know where to start.
GPTs for Data science are the next step towards innovation in various data-related tasks. These are platforms that integrate the field of dataanalytics with artificial intelligence (AI) and machine learning (ML) solutions. Other data science tasks include data preprocessing, visualization, and statistical analysis.
Other data science tasks include data preprocessing, visualization, and statistical analysis. Data science GPTs are useful in enhancing the accuracy and efficiency of complex analytical processes. Moreover, AI-powered tools can uncover new data insights and correlations that can go unnoticed otherwise.
Advancement in big data technology has made the world of business even more competitive. The proper use of business intelligence and analyticaldata is what drives big brands in a competitive market. Business intelligence tools can include data warehousing, datavisualizations, dashboards, and reporting.
or master’s degree is only valuable for specific data science roles. For instance, higher education is useful in pursuing research in data science. However, if you’re interested in working on real-life complex data problems using dataanalytics methods such as deep learning, only knowledge of those methods is necessary.
Summary: In the modern digital landscape, dataanalytics has emerged as a powerful tool for businesses and industries seeking valuable insights to drive decision-making and improve performance. Today, it is imperative for companies to adopt the data driven decision making processes.
Summary: Business Intelligence Analysts transform raw data into actionable insights. They use tools and techniques to analyse data, create reports, and support strategic decisions. Key skills include SQL, datavisualization, and business acumen. Introduction We are living in an era defined by data.
Data Science is used in different areas of our life and can help companies to deal with the following situations: Using predictive analytics to prevent fraud Using machine learning to streamline marketing practices Using dataanalytics to create more effective actuarial processes. Where to Use Data Mining?
As a venture grows, it becomes tedious to keep track of the analyticaldata of the enterprise which, in turn, forms a road-block to decision making. Employing an analytical system in a data-driven business can help it to discover useful trends, information, conclusions and elevated decision making.
This feature helps automate many parts of the data preparation and datamodel development process. This significantly reduces the amount of time needed to engage in data science tasks. A text analytics interface that helps derive actionable insights from unstructured data sets.
It is the process of converting raw data into relevant and practical knowledge to help evaluate the performance of businesses, discover trends, and make well-informed choices. Data gathering, data integration, datamodelling, analysis of information, and datavisualization are all part of intelligence for businesses.
Data Lakes are among the most complex and sophisticated data storage and processing facilities we have available to us today as human beings. Analytics Magazine notes that data lakes are among the most useful tools that an enterprise may have at its disposal when aiming to compete with competitors via innovation.
This week, Gartner published the 2021 Magic Quadrant for Analytics and Business Intelligence Platforms. I first want to thank you, the Tableau Community, for your continued support and your commitment to data, to Tableau, and to each other. Accelerate adoption with intuitive analytics that people love to use. Francois Ajenstat.
Its your feedback and collaboration that help us push the boundaries of whats possible in datavisualization and analytics. Together, these features not only streamline your workflow but also enhance the overall clarity and attention to important data points and anomalies.
Now powered by Tableau, Genie brings that trusted, up-to-the-moment customer data to life by layering on visual, explorable, and actionable analytics and insights. . Cut costs by consolidating data warehouse investments. Take action with AI-powered insights in the flow of work. How do Genie and Tableau work together? .
Now powered by Tableau, Genie brings that trusted, up-to-the-moment customer data to life by layering on visual, explorable, and actionable analytics and insights. . Cut costs by consolidating data warehouse investments. Take action with AI-powered insights in the flow of work. How do Genie and Tableau work together? .
Furthermore, a study indicated that 71% of organisations consider DataAnalytics a critical factor for enhancing their business performance. Key Takeaways Business Intelligence tools collect and analyse data from diverse sources for actionable insights. Data Processing: Cleaning and organizing data for analysis.
The survey found that data science & machine learning professionals were the most stressed among all IT professionals, with stress levels surpassing the IT sector average by 16.16 Conversely, IT Project Management & Business Analytics professionals were the least stressed among IT workers. percentage points.
Research indicates that companies utilizing advanced analytics are 5 times more likely to make faster decisions than their competitors. Key Components of Business Intelligence Architecture Business Intelligence (BI) architecture is a structured framework that enables organizations to gather, analyze, and present data effectively.
Architecturally the introduction of Hadoop, a file system designed to store massive amounts of data, radically affected the cost model of data. Organizationally the innovation of self-service analytics, pioneered by Tableau and Qlik, fundamentally transformed the user model for data analysis.
Proficient in programming languages like Python or R, data manipulation libraries like Pandas, and machine learning frameworks like TensorFlow and Scikit-learn, data scientists uncover patterns and trends through statistical analysis and datavisualization. DataVisualization: Matplotlib, Seaborn, Tableau, etc.
It uses advanced tools to look at raw data, gather a data set, process it, and develop insights to create meaning. Areas making up the data science field include mining, statistics, dataanalytics, datamodeling, machine learning modeling and programming. appeared first on IBM Blog.
Summary: Tableau is fantastic for datavisualization, but understanding your data is key. Data types in Tableau act like labels, telling Tableau if it’s a number for calculations, text for labels, or a date for trends. Using the right type ensures accuracy and avoids misleading visuals. Well, Pickl.AI
Mastering skills helps stay ahead with the current data landscape and prepare for future transformations. A data engineering career has become highly crucial due to the need for a harmonious interflow of technical prowess, analytical thinking, and problem-solving agility. Hadoop, Spark).
Tableau Next is a reimagined analytics experience: an open, composable, enterprise-grade data and analytics platform built on the Salesforce Platform and deeply integrated with Agentforce, a suite of customizable AI agents and tools. What is Tableau Next and why now?
Tableau Einstein is a reimagined analytics experience: an open, composable, enterprise-grade data and analytics platform built on the Salesforce Platform and deeply integrated with Agentforce, a suite of customizable AI agents and tools. What is Tableau Einstein and why now?
Trends shaping careers, like AI integration and real-time analytics, highlight the evolving industry demands. The Data Analyst career growth section emphasises the value of specialisation in a field with substantial job openings in India. ’ In this digital era, Data Analysts fuel innovation.
If you’re running complex analytical or pathfinding queries with four or more node “hops” from your root node, then a graph database is usually the best solution for you. Save time on mapping and modeling The human brain works by making connections. Interested in building your datamodel?
We organize all of the trending information in your field so you don't have to. Join 17,000+ users and stay up to date on the latest articles your peers are reading.
You know about us, now we want to get to know you!
Let's personalize your content
Let's get even more personalized
We recognize your account from another site in our network, please click 'Send Email' below to continue with verifying your account and setting a password.


Let's personalize your content