This site uses cookies to improve your experience. To help us insure we adhere to various privacy regulations, please select your country/region of residence. If you do not select a country, we will assume you are from the United States. Select your Cookie Settings or view our Privacy Policy and Terms of Use.
Cookie Settings
Cookies and similar technologies are used on this website for proper function of the website, for tracking performance analytics and for marketing purposes. We and some of our third-party providers may use cookie data for various purposes. Please review the cookie settings below and choose your preference.
Used for the proper function of the website
Used for monitoring website traffic and interactions
Cookie Settings
Cookies and similar technologies are used on this website for proper function of the website, for tracking performance analytics and for marketing purposes. We and some of our third-party providers may use cookie data for various purposes. Please review the cookie settings below and choose your preference.
Strictly Necessary: Used for the proper function of the website
Performance/Analytics: Used for monitoring website traffic and interactions
Introduction PowerBI uses a set of functions, operators, and constants called DAX to perform dynamic computations and analysis. One can enhance their PowerBI competency by using DAX features that help in datamodeling and reporting.
Data is an essential component of any business, and it is the role of a data analyst to make sense of it all. PowerBI is a powerfuldata visualization tool that helps them turn raw data into meaningful insights and actionable decisions. How does a data analyst use PowerBI?
Summary: This PowerBI DAX tutorial introduces beginners to the fundamentals of Data Analysis Expressions, including syntax, functions, and context. It covers creating measures and calculated columns, using aggregate functions, and applying time intelligence for advanced Data Analysis. What is DAX?
When thinking about PowerBI , the platform’s visuals and report side immediately come to mind. While the front-end report visuals are important and the most visible to end users, a lot goes on behind the scenes that contribute heavily to the end product, including datamodeling. What is DataModeling?
As a venture grows, it becomes tedious to keep track of the analyticaldata of the enterprise which, in turn, forms a road-block to decision making. Employing an analytical system in a data-driven business can help it to discover useful trends, information, conclusions and elevated decision making.
It offers full BI-Stack Automation, from source to data warehouse through to frontend. It supports a holistic datamodel, allowing for rapid prototyping of various models. It also supports a wide range of data warehouses, analytical databases, data lakes, frontends, and pipelines/ETL.
How to Optimize PowerBI and Snowflake for Advanced Analytics Spencer Baucke May 25, 2023 The world of business intelligence and data modernization has never been more competitive than it is today. Much of what is discussed in this guide will assume some level of analytics strategy has been considered and/or defined.
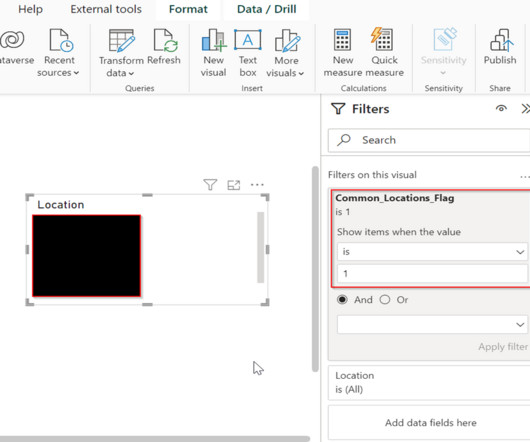
Row-level security is a powerfuldata governance capability across many business intelligence platforms, and PowerBI is no exception. Learning how to implement row-level security is critical for any PowerBI developer hoping to add an extra layer of security to their reports and datasets.
New big data architectures and, above all, data sharing concepts such as Data Mesh are ideal for creating a common database for many data products and applications. The Event Log DataModel for Process Mining Process Mining as an analytical system can very well be imagined as an iceberg.
Skills and Training Familiarity with ethical frameworks like the IEEE’s Ethically Aligned Design, combined with strong analytical and compliance skills, is essential. Strong analytical skills and the ability to work with large datasets are critical, as is familiarity with datamodeling and ETL processes.
Summary: PowerBI is a business analytics tool transforming data into actionable insights. Key features include AI-poweredanalytics, extensive data connectivity, customisation options, and robust datamodelling. It offers AI-driven analytics, including Natural Language Processing.
Summary: PowerBI is a leading dataanalytics platform offering advanced features like real-time analytics and collaborative capabilities. Understanding its significance is vital for aspiring PowerBI developers. Optimising PowerBI reports for performance ensures efficient data analysis.
Additionally, we will provide a distinction between measures and calculated columns in datamodeling and visualization. In PowerBI , the measure is used to calculate aggregations and percentages or when you require a single value for a group of rows. The measure name must be unique throughout the entire model.
The Datamarts capability opens endless possibilities for organizations to achieve their dataanalytics goals on the PowerBI platform. Before we look into the PowerBI Datamarts, let us take a step back and understand the meaning of a Datamart. What is PowerBI Datamarts?
Summary: PowerBI alternatives like Tableau, Qlik Sense, and Zoho Analytics provide businesses with tailored Data Analysis and Visualisation solutions. Selecting the right alternative ensures efficient data-driven decision-making and aligns with your organisation’s goals and budget. What is PowerBI?
Summary: Counting rows is a fundamental task in PowerBI that requires careful consideration. This blog explores how to get total number of rows in power query. Understanding PowerBI and Its Importance PowerBI is a suite of business analytics tools that allows users to analyze data and share insights.
GPTs for Data science are the next step towards innovation in various data-related tasks. These are platforms that integrate the field of dataanalytics with artificial intelligence (AI) and machine learning (ML) solutions. Moreover, they can uncover new data insights and correlations that can go unnoticed otherwise.
Though you may encounter the terms “data science” and “dataanalytics” being used interchangeably in conversations or online, they refer to two distinctly different concepts. Meanwhile, dataanalytics is the act of examining datasets to extract value and find answers to specific questions.
By presenting data visually, organisations can communicate insights more clearly and drive strategic decisions based on real-time analytics. Reveals hidden patterns and trends within large volumes of data. Supports predictive analytics to anticipate market trends and behaviours.
PowerBI Datamarts is one of the most exciting features that Microsoft has released for the Power Platform in recent years. If you need high-level information on what a PowerBI Datamart is and some example use cases, check out our other blog, What Are PowerBI Datamarts?
QGIS, Microsoft's PowerBI, Tableau, and Jupyter notebooks also facilitated many interesting visualizations, particularly for solvers with less programming experience. Many participants used beginner-friendly online interfaces, like NASA Worldview and Giovanni , to explore and manipulate data. He holds a B.S.
The current BI trends show that in the future, the BI software will be more accessible, so that even non-techie workers will rely on data insights in their working routine. This shows why self-service BI is on the rise. Prescriptive Analytics. Automation & Augmented Analytics. SAP Lumira.
GPTs for Data science are the next step towards innovation in various data-related tasks. These are platforms that integrate the field of dataanalytics with artificial intelligence (AI) and machine learning (ML) solutions. Other data science tasks include data preprocessing, visualization, and statistical analysis.
Other data science tasks include data preprocessing, visualization, and statistical analysis. Data science GPTs are useful in enhancing the accuracy and efficiency of complex analytical processes. Moreover, AI-powered tools can uncover new data insights and correlations that can go unnoticed otherwise.
This involves considering aspects like: Ensuring data accuracy Emphasizing clarity and precision Incorporating a meaningful color palette Utilizing pre-attentive attributes effectively to guide viewer attention Meanwhile, Kaiser Fung’s Junk Charts Trifecta Checkup takes a more analytical approach to visualization.
Key Takeaways Operations Analysts optimise efficiency through data-driven decision-making. Expertise in tools like PowerBI, SQL, and Python is crucial. They leverage advanced analytics tools and software to analyse performance metrics, monitor trends, and create detailed reports.
According to a report by Gartner, organizations that utilize BI tools can improve their operational efficiency and gain competitive advantages over rivals. Furthermore, a study indicated that 71% of organisations consider DataAnalytics a critical factor for enhancing their business performance.
This blog will comprehensively explore the world of BI, dissecting what it is, the multifaceted responsibilities of a BI Analyst, and how to embark on this rewarding career path. Key Takeaways BI Analysts convert data into actionable insights for strategic business decisions. Cultivate attention to detail and accuracy.
It is the process of converting raw data into relevant and practical knowledge to help evaluate the performance of businesses, discover trends, and make well-informed choices. Data gathering, data integration, datamodelling, analysis of information, and data visualization are all part of intelligence for businesses.
Some of the common career opportunities in BI include: Entry-level roles Data analyst: A data analyst is responsible for collecting and analyzing data, creating reports, and presenting insights to stakeholders. They may also be involved in datamodeling and database design.
Some of the common career opportunities in BI include: Entry-level roles Data analyst: A data analyst is responsible for collecting and analyzing data, creating reports, and presenting insights to stakeholders. They may also be involved in datamodeling and database design.
The importance of SQL for Data Analysts is identified within organisations for understanding complex datasets and managing large volumes of data. The starting range for a SQL Data Analyst is $61,128 per annum. How SQL Important in DataAnalytics?
A survey by Dresner Advisory Services found that 53% of organizations consider BI a critical component for business success. Research indicates that companies utilizing advanced analytics are 5 times more likely to make faster decisions than their competitors. Data Lakes: These store raw, unprocessed data in its original format.
But its status as the go-between for programming and data professionals isn’t its only power. Within SQL you can also filter data, aggregate it and create valuations, manipulate data, update it, and even do datamodeling. One set of tools that are becoming more important in our data-driven world is BI tools.
Mastering skills helps stay ahead with the current data landscape and prepare for future transformations. A data engineering career has become highly crucial due to the need for a harmonious interflow of technical prowess, analytical thinking, and problem-solving agility. Hadoop, Spark).
Hierarchies align datamodelling with business processes, making it easier to analyse data in a context that reflects real-world operations. Designing Hierarchies Designing effective hierarchies requires careful consideration of the business requirements and the datamodel.
Because they are the most likely to communicate data insights, they’ll also need to know SQL, and visualization tools such as PowerBI and Tableau as well. Machine Learning Engineer Machine learning engineers will use data much differently than business analysts or data analysts.
Additionally, it addresses common challenges and offers practical solutions to ensure that fact tables are structured for optimal data quality and analytical performance. Introduction In today’s data-driven landscape, organisations are increasingly reliant on DataAnalytics to inform decision-making and drive business strategies.
To transform raw data into actionable insights that illuminate the path towards informed decision-making. Enters: Tableau for Data Analyst. Tableau, a visual analytics platform that acts as a translator, transforming complex datasets into clear, compelling narratives. Their ultimate goal? This course prepares you for the future.
With expertise in Python, machine learning algorithms, and cloud platforms, machine learning engineers optimize models for efficiency, scalability, and maintenance. Together, data engineers, data scientists, and machine learning engineers form a cohesive team that drives innovation and success in dataanalytics and artificial intelligence.
Tableau is an interactive platform that enables users to analyse and visualise data to gain insights. Tableau also supports advanced statistical modeling through integration with statistical tools like R and Python. Accordingly, Tableau Data Scientist salary is generally more than those experts having specialisation in PowerBI.
The healthcare industry uses MongoDB to manage patient records and genomic data, which requires flexibility and scalability. Furthermore, financial services rely on MongoDB for fraud detection and real-time analytics due to its powerful querying and indexing capabilities. 2024’s top PowerBI interview questions simplified.
BI provides real-time data analysis and performance monitoring, while Data Science enables a deep dive into dependencies in data with data mining and automates decision making with predictive analytics and personalized customer experiences. Each applications has its own datamodel.
We organize all of the trending information in your field so you don't have to. Join 17,000+ users and stay up to date on the latest articles your peers are reading.
You know about us, now we want to get to know you!
Let's personalize your content
Let's get even more personalized
We recognize your account from another site in our network, please click 'Send Email' below to continue with verifying your account and setting a password.


Let's personalize your content