This site uses cookies to improve your experience. To help us insure we adhere to various privacy regulations, please select your country/region of residence. If you do not select a country, we will assume you are from the United States. Select your Cookie Settings or view our Privacy Policy and Terms of Use.
Cookie Settings
Cookies and similar technologies are used on this website for proper function of the website, for tracking performance analytics and for marketing purposes. We and some of our third-party providers may use cookie data for various purposes. Please review the cookie settings below and choose your preference.
Used for the proper function of the website
Used for monitoring website traffic and interactions
Cookie Settings
Cookies and similar technologies are used on this website for proper function of the website, for tracking performance analytics and for marketing purposes. We and some of our third-party providers may use cookie data for various purposes. Please review the cookie settings below and choose your preference.
Strictly Necessary: Used for the proper function of the website
Performance/Analytics: Used for monitoring website traffic and interactions
By Bala Priya C , KDnuggets Contributing Editor & Technical Content Specialist on June 19, 2025 in Programming Image by Author | Ideogram Youre architecting a new data pipeline or starting an analytics project, and you’re probably considering whether to use Python or Go. Five years ago, this wasnt even a debate.
Exploratorydataanalysis (EDA) is a critical component of data science that allows analysts to delve into datasets to unearth the underlying patterns and relationships within. EDA serves as a bridge between raw data and actionable insights, making it essential in any data-driven project.
t-SNE (t-distributed stochastic neighbor embedding) has become an essential tool in the realm of dataanalytics, standing out for its ability to unravel the complexities inherent in high-dimensional data.
They are expected to be versatile, handling everything from data engineering and exploratoryanalysis to deploying machine learning models and communicating insights to business stakeholders. Data quality issues are common in Indian datasets, so cleaning and preprocessing are critical. Manufacturing: Industry 4.0
As the demand for data expertise continues to grow, understanding the multifaceted role of a data scientist becomes increasingly relevant. What is a data scientist? A data scientist integrates data science techniques with analytical rigor to derive insights that drive action.
ArticleVideo Book This article was published as a part of the Data Science Blogathon Photo by fauxels from Pexels What is ExploratoryDataAnalysis? Exploratory. The post ExploratoryDataAnalysis and Visualization Techniques in Data Science appeared first on Analytics Vidhya.
This article was published as a part of the Data Science Blogathon. Introduction ExploratoryDataAnalysis(EDA) is one of the most underrated and under-utilized. The post ExploratoryDataAnalysis – The Go-To Technique to Explore Your Data! appeared first on Analytics Vidhya.
Introduction to EDA The main objective of this article is to cover the steps involved in Data pre-processing, Feature Engineering, and different stages of ExploratoryDataAnalysis, which is an essential step in any research analysis.
Introduction ExploratoryDataAnalysis is a method of evaluating or comprehending data in order to derive insights or key characteristics. EDA can be divided into two categories: graphical analysis and non-graphical analysis. EDA is a critical component of any data science or machine learning process.
This article was published as a part of the Data Science Blogathon What is EDA(Exploratorydataanalysis)? Exploratorydataanalysis is a great way of understanding and analyzing the data sets. The post ExploratoryDataAnalysis on UBER Stocks Dataset appeared first on Analytics Vidhya.
Introduction Exploratorydataanalysis is one of the best practices used in data science today. While starting a career in Data Science, people generally. The post ExploratoryDataAnalysis(EDA) from scratch in Python! appeared first on Analytics Vidhya.
ArticleVideos This article was published as a part of the Data Science Blogathon. Introduction Let us walk through the ExploratoryDataAnalysis on NYC. The post ExploratoryDataAnalysis on NYC Taxi Trip Duration Dataset appeared first on Analytics Vidhya.
ArticleVideo Book This article was published as a part of the Data Science Blogathon. Topic to be covered What is ExploratoryDataAnalysis What. The post Top Python Libraries to Automate ExploratoryDataAnalysis in 2021 appeared first on Analytics Vidhya.
ArticleVideo Book This article was published as a part of the Data Science Blogathon. The post Mastering ExploratoryDataAnalysis(EDA) For Data Science Enthusiasts appeared first on Analytics Vidhya. Overview Step by Step approach to Perform EDA Resources Like.
The post ExploratoryDataAnalysis of Zomato Bangalore Restaurants appeared first on Analytics Vidhya. Giant food aggregators and food shipping companies like Zomato have made it feasible. Zomato is one of India’s most extensively […].
Introduction ExploratoryDataAnalysis, or EDA, examines the data and identifies potential relationships between variables using numerical summaries and visualisations. We use summary statistics and graphical tools to get to know our data and understand what we may deduce from them during EDA. […].
Overview matplotlib is a widely used Python library for performing datavisualization and exploratorydataanalysis These 10 matplotlib tricks will enable you to. The post 10 matplotlib Tricks to Master DataVisualization in Python appeared first on Analytics Vidhya.
The post ExploratoryDataAnalysis (EDA) on Lead Scoring Dataset appeared first on Analytics Vidhya. Leads are generally captured by tracking the user’s actions, like how much they visit the website, asking them to fill up some forms, etc. Leads […].
This article was published as a part of the Data Science Blogathon. Introduction ExploratoryDataAnalysis is an approach to discover the insights in. The post How to Improve Your Business With ExploratoryDataAnalysis! appeared first on Analytics Vidhya.
ArticleVideo Book This article was published as a part of the Data Science Blogathon Introduction ExploratoryDataAnalysis or EDA is a vital step in. The post Using Seaborn’s FacetGrid Based Methods for ExploratoryDataAnalysis appeared first on Analytics Vidhya.
ArticleVideo Book This article was published as a part of the Data Science Blogathon Introduction Hello, Welcome to the world of EDA using DataVisualization. The post ExploratoryDataAnalysis using DataVisualization Techniques! appeared first on Analytics Vidhya.
ArticleVideo Book This article was published as a part of the Data Science Blogathon Overview Python Pandas library is becoming most popular between data scientists. The post EDA – ExploratoryDataAnalysis Using Python Pandas and SQL appeared first on Analytics Vidhya.
This article was published as a part of the Data Science Blogathon. Introduction ExploratoryDataAnalysis helps in identifying any outlier data points, understanding the relationships between the various attributes and structure of the data, recognizing the important variables.
ArticleVideo Book This article was published as a part of the Data Science Blogathon ExploratoryDataAnalysis, or EDA, is an important step in any. The post ExploratoryDataAnalysis (EDA) – A step by step guide appeared first on Analytics Vidhya.
ArticleVideo Book This article was published as a part of the Data Science Blogathon Introduction Exploratorydataanalysis is an approach to analyzing data sets. The post ExploratoryDataAnalysis : A Beginners Guide To Perform EDA appeared first on Analytics Vidhya.
The post The Clever Ingredient that decides the rise and the fall of your Machine Learning Model- ExploratoryDataAnalysis appeared first on Analytics Vidhya. Introduction Well! We all love cakes. If you take a deeper look.
ArticleVideo Book This article was published as a part of the Data Science Blogathon Introduction Many engineers have never worked in statistics or data science. The post Know the basics of ExploratoryDataAnalysis appeared first on Analytics Vidhya.
Introduction Datavisualization is crucial in DataAnalytics. With exploratorydataanalysis (EDA), we gain insights into the hidden trends and patterns in a dataset that are useful for decision-making. The post Interactive DataVisualization Using Bqplot appeared first on Analytics Vidhya.
The post Using DataVisualization to Explore the Human Space Race! appeared first on Analytics Vidhya. We have seen signs and visions in celestial bodies. In the previous century, we finally had the technology to […].
ArticleVideo Book This article was published as a part of the Data Science Blogathon Introduction : As the title suggests, we will be exploring data. The post Walk Through of Haberman Cancer Survival Dataset ExploratoryDataAnalysis appeared first on Analytics Vidhya.
This article was published as a part of the Data Science Blogathon image source: Author The Importance of DataVisualization A huge amount of data is being generated every instant due to business activities in globalization. ExploratoryDataanalysis can help […].
Introduction on DataVisualizationDataVisualization is an interdisciplinary discipline concerned with the visual depiction of data. When the data is large, such as in a time series, it is a very effective manner of communicating.
Overview In this article, we will be analyzing the flight fare prediction using Machine Learning dataset using essential exploratorydataanalysis techniques then will draw some predictions about the price of the flight based on some features such as what type of airline it […].
Table of Contents Introduction Working with dataset Creating loss dataframe VisualizationsAnalysis from Heatmap Overall Analysis Conclusion Introduction In this article, I am going to perform ExploratoryDataAnalysis on the Sample Superstore dataset.
Introduction In the realm of data science, the initial step towards understanding and analyzing data involves a comprehensive exploratorydataanalysis (EDA). This process is pivotal for recognizing patterns, identifying anomalies, and establishing hypotheses.
This article was published as a part of the Data Science Blogathon. An exploratorydataanalysis article of the best cities for your next workcation. appeared first on Analytics Vidhya. The post Where Should your Next Work-Vacation Be?
This is where a data workflow is essential, allowing you to turn your raw data into actionable insights. In this article, well explore how that workflow covering aspects from data collection to datavisualizations can tackle the real-world challenges.
These skills include programming languages such as Python and R, statistics and probability, machine learning, datavisualization, and data modeling. Prepare data for effective analysis One important data scientist skill is preparing data for effective analysis.
Four Essential Tools Every Data Scientist Should Have in Their Toolbox This member-only story is on us. Photo by Adam Śmigielski on Unsplash It’s a great time to be a data scientist! Last Updated on September 8, 2023 by Editorial Team Author(s): Francis Adrian Viernes Originally published on Towards AI. Upgrade to access all of Medium.
Overview In this article, we will be predicting the income of US people based on the US census data and later we will be concluding whether that individual American have earned more or less than 50000 dollars a year. The post Analyzing the Income Level of US Census Data appeared first on Analytics Vidhya.
The post Rapid-Fire EDA process using Python for ML Implementation appeared first on Analytics Vidhya. ArticleVideo Book Understand the ML best practice and project roadmap When a customer wants to implement ML(Machine Learning) for the identified business problem(s) after.
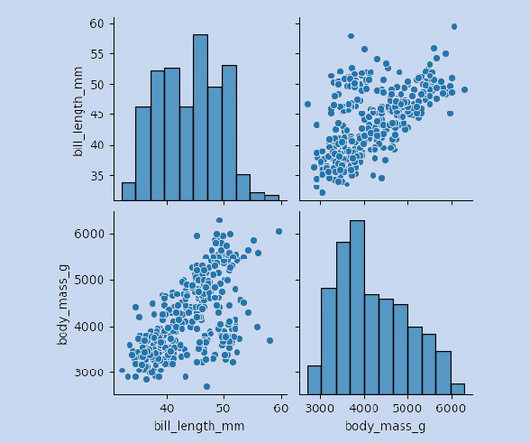
Summary: ExploratoryDataAnalysis (EDA) uses visualizations to uncover patterns and trends in your data. Histograms, scatter plots, and charts reveal relationships and outliers, helping you understand your data and make informed decisions. Imagine a vast, uncharted territory – your data set.
ArticleVideo Book This article was published as a part of the Data Science Blogathon. The post Beginners Guide to Explanatory DataAnalysis appeared first on Analytics Vidhya. Introduction As we all know there are certain processes to.
We organize all of the trending information in your field so you don't have to. Join 17,000+ users and stay up to date on the latest articles your peers are reading.
You know about us, now we want to get to know you!
Let's personalize your content
Let's get even more personalized
We recognize your account from another site in our network, please click 'Send Email' below to continue with verifying your account and setting a password.


Let's personalize your content