This site uses cookies to improve your experience. To help us insure we adhere to various privacy regulations, please select your country/region of residence. If you do not select a country, we will assume you are from the United States. Select your Cookie Settings or view our Privacy Policy and Terms of Use.
Cookie Settings
Cookies and similar technologies are used on this website for proper function of the website, for tracking performance analytics and for marketing purposes. We and some of our third-party providers may use cookie data for various purposes. Please review the cookie settings below and choose your preference.
Used for the proper function of the website
Used for monitoring website traffic and interactions
Cookie Settings
Cookies and similar technologies are used on this website for proper function of the website, for tracking performance analytics and for marketing purposes. We and some of our third-party providers may use cookie data for various purposes. Please review the cookie settings below and choose your preference.
Strictly Necessary: Used for the proper function of the website
Performance/Analytics: Used for monitoring website traffic and interactions
Introduction This article will introduce the concept of datamodeling, a crucial process that outlines how data is stored, organized, and accessed within a database or data system.
Through big datamodeling, data-driven organizations can better understand and manage the complexities of big data, improve businessintelligence (BI), and enable organizations to benefit from actionable insight.
As the use of intelligence technologies is staggering, knowing the latest trends in businessintelligence is a must. The market for businessintelligence services is expected to reach $33.5 top 5 key platforms that control the future of businessintelligence impacts BI may have on your business in the future.
One can enhance their Power BI competency by using DAX features that help in datamodeling and reporting. This article examines the top DAX features that any Power BI user should know. Introduction Power BI uses a set of functions, operators, and constants called DAX to perform dynamic computations and analysis.
In today’s fast-paced business landscape, companies need to stay ahead of the curve to remain competitive. Businessintelligence (BI) has emerged as a key solution to help companies gain insights into their operations and market trends. What is businessintelligence?
In today’s fast-paced business landscape, companies need to stay ahead of the curve to remain competitive. Businessintelligence (BI) has emerged as a key solution to help companies gain insights into their operations and market trends. What is businessintelligence?
There are such huge volumes of data generated in real-time that several businesses don’t know what to do with all of it. Unless big data is converted to actionable insights, there is nothing much an enterprise can do. And outdated datamodels no longer […].
According to Cognizant, nearly 70% of teams that made major or significant changes to their analytical models now make more accurate predictions, compared to 45% who preferred to leave things as they were. In this article, we’ll take a closer look at why companies should seek new approaches to data analytics.
As data lakes gain prominence as a preferred solution for storing and processing enormous datasets, the need for effective data version control mechanisms becomes increasingly evident. Storage Optimization: Data warehouses use columnar storage formats and indexing to enhance query performance and data compression.
ETL (Extract, Transform, Load) is a crucial process in the world of data analytics and businessintelligence. In this article, we will explore the significance of ETL and how it plays a vital role in enabling effective decision making within businesses.
Summary: Power BI is a business analytics tool transforming data into actionable insights. Key features include AI-powered analytics, extensive data connectivity, customisation options, and robust datamodelling. Key Takeaways It transforms raw data into actionable, interactive visualisations. Why Power BI?
Enterprise Intelligence,” by Eugene Asahara, is one such book. Eugene takes three basic ingredients that are not so new (businessintelligence, knowledge graphs, and large language models), […]
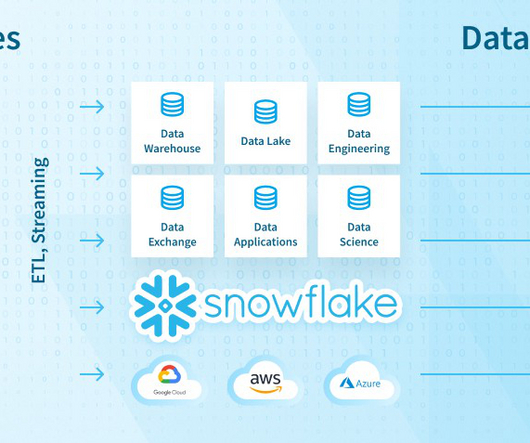
Enterprises are modernizing their data platforms and associated tool-sets to serve the fast needs of data practitioners, including data scientists, data analysts, businessintelligence and reporting analysts, and self-service-embracing business and technology personnel.
This article is an excerpt from the book Expert DataModeling with Power BI, Third Edition by Soheil Bakhshi, a completely updated and revised edition of the bestselling guide to Power BI and datamodeling. Then we have some other ETL processes to constantly land the past 5 years of data into the Datamarts.
In the digital era, data visualization stands as an indispensable tool in the realm of businessintelligence. It represents the graphical display of data and information, transforming complex datasets into intuitive and understandable visuals. One of the most powerful techniques in datamodeling is drill-through.
Steve Hoberman has been a long-time contributor to The Data Administration Newsletter (TDAN.com), including his The Book Look column since 2016, and his The DataModeling Addict column years before that.
A metadata-driven data warehouse (MDW) offers a modern approach that is designed to make EDW development much more simplified and faster. It makes use of metadata (data about your data) as its foundation and combines datamodeling and ETL functionalities to build data warehouses.
Unfortunately, even the data science industry — which should recognize tabular data’s true value — often underestimates its relevance in AI. Many mistakenly equate tabular data with businessintelligence rather than AI, leading to a dismissive attitude toward its sophistication.
In my first article, I laid out the basic premise for this series: an examination of how Agile has gone from the darling of the application development community to a virtual pariah that nobody wants to be associated with, and an exploration of the very important question of what we should replace it with. We […]
Optimising Power BI reports for performance ensures efficient data analysis. Power BI proficiency opens doors to lucrative data analytics and businessintelligence opportunities, driving organisational success in today’s data-driven landscape. Calculated columns help create new fields based on existing data.
Today, companies are facing a continual need to store tremendous volumes of data. The demand for information repositories enabling businessintelligence and analytics is growing exponentially, giving birth to cloud solutions. Data warehousing is a vital constituent of any businessintelligence operation.
Over the past few months, my team in Castlebridge and I have been working with clients delivering training to business and IT teams on data management skills like data governance, data quality management, datamodelling, and metadata management.
Selecting the right alternative ensures efficient data-driven decision-making and aligns with your organisation’s goals and budget. Introduction Power BI has become one of the most popular businessintelligence (BI) tools, offering powerful Data Visualisation, reporting, and decision-making features. billion to USD 54.27
The traditional data science workflow , as defined by Joe Blitzstein and Hanspeter Pfister of Harvard University, contains 5 key steps: Ask a question. Get the data. Explore the data. Model the data. A data catalog can assist directly with every step, but model development.
Eric Siegel’s “The AI Playbook” serves as a crucial guide, offering important insights for data professionals and their internal customers on effectively leveraging AI within business operations.
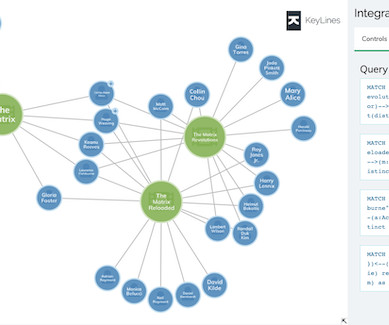
Multi-model databases combine graphs with two other NoSQL datamodels – document and key-value stores. RDF vs property graphs Another way to categorize graph databases is by their data structure. RDF vs property graphs Another way to categorize graph databases is by their data structure.
Graphs, charts with colors, lines and shapes can often tell a story and communicate issues, challenges and opportunities in a business environment. Research has shown that many people learn best when they see a story or information depicted in an image.
If you are planning on using predictive algorithms, such as machine learning or data mining, in your business, then you should be aware that the amount of data collected can grow exponentially over time.
The purpose of data visualization is to facilitate the perception of information arrays and to identify patterns that are difficult to notice in a text table. To make a useful and powerful infographic, you need to follow the laws and regulations of data visualization.
NoSQL database systems continue to gain traction, but they are still not widely understood. There is more than one type of NoSQL database and a large number of individual NoSQL DBMSs. There are more than 225 NoSQL DBMSs listed on the NoSQL Database website alone and it just is not possible to review and understand every option. […].
In an industry as competitive as eCommerce retail, the ability to turn data into actionable insights presents the opportunity to make business decisions that drive more revenue and control costs. Click to learn more about author Maurice Lacroix.
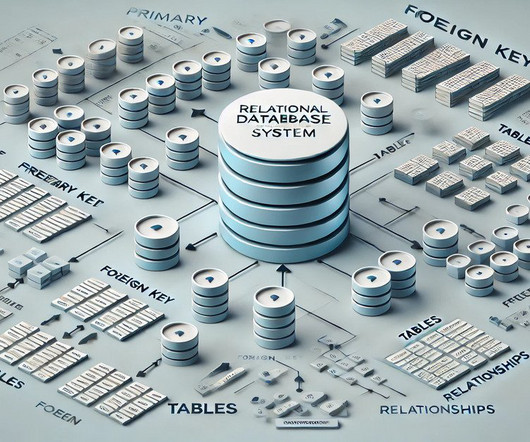
Summary: Relational Database Management Systems (RDBMS) are the backbone of structured data management, organising information in tables and ensuring data integrity. This article explores RDBMS’s features, advantages, applications across industries, the role of SQL, and emerging trends shaping the future of data management.
Twenty-five years ago today, I published the first issue of The Data Administration Newsletter. It only took a few months to recognize that there was an audience for an “online” publication focused on data administration. […].
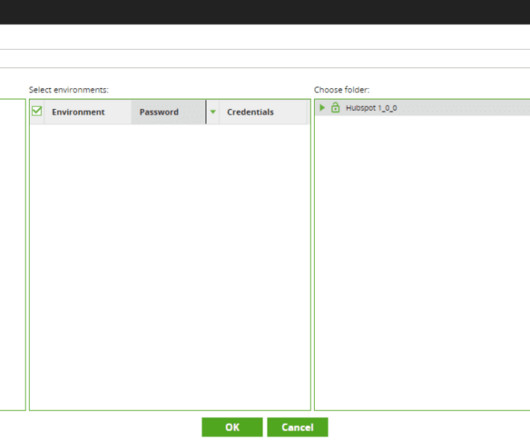
When a new entrant to ETL development reads this article, they could easily have mastered Matillion Designer’s methods or read through the Matillion Versioning Documentation to develop their own approach to ZDLC. One scenario could be multiple team members who will each work on ingesting and processing data from one of the source systems.
Introduction We are living in the age of a data revolution, and more corporations are realizing that to lead—or in some cases, to survive—they need to harness their data wealth effectively.
Taking them into account, different cloud providers nowadays offer services and tools with many hypothetical scenarios and solutions, nevertheless, the reality is often far from what you read in blogs and articles. Architectural design The environment architecture is shown in figure 1 as a whole with all its resources.
In discussions with data management professionals, conversations often veer toward the technical intricacies of migration to the cloud or algorithm optimization, overshadowing the core business objectives that originally spurred these initiatives.
The focus of my last column, titled Crossing the Data Divide: Data Catalogs and the Generative AI Wave, was on the impact of large language models (LLM) and generative artificial intelligence (AI) and how we disseminate knowledge throughout the enterprise and the future role of the data catalogs.
Data engineering is a fascinating and fulfilling career – you are at the helm of every business operation that requires data, and as long as users generate data, businesses will always need data engineers. The journey to becoming a successful data engineer […].
Social media conversations, comments, customer reviews, and image data are unstructured in nature and hold valuable insights, many of which are still being uncovered through advanced techniques like Natural Language Processing (NLP) and machine learning. Many find themselves swamped by the volume and complexity of unstructured data.
Data often arrives from multiple sources in inconsistent forms, including duplicate entries from CRM systems, incomplete spreadsheet records, and mismatched naming conventions across databases. These issues slow analysis pipelines and demand time-consuming cleanup.
We organize all of the trending information in your field so you don't have to. Join 17,000+ users and stay up to date on the latest articles your peers are reading.
You know about us, now we want to get to know you!
Let's personalize your content
Let's get even more personalized
We recognize your account from another site in our network, please click 'Send Email' below to continue with verifying your account and setting a password.


Let's personalize your content