This site uses cookies to improve your experience. To help us insure we adhere to various privacy regulations, please select your country/region of residence. If you do not select a country, we will assume you are from the United States. Select your Cookie Settings or view our Privacy Policy and Terms of Use.
Cookie Settings
Cookies and similar technologies are used on this website for proper function of the website, for tracking performance analytics and for marketing purposes. We and some of our third-party providers may use cookie data for various purposes. Please review the cookie settings below and choose your preference.
Used for the proper function of the website
Used for monitoring website traffic and interactions
Cookie Settings
Cookies and similar technologies are used on this website for proper function of the website, for tracking performance analytics and for marketing purposes. We and some of our third-party providers may use cookie data for various purposes. Please review the cookie settings below and choose your preference.
Strictly Necessary: Used for the proper function of the website
Performance/Analytics: Used for monitoring website traffic and interactions
This article was published as a part of the Machine Learning. Introduction This article is about predicting SONAR rocks against Mines with the help of Machine Learning. The post Predicting SONAR Rocks Against Mines with ML appeared first on Analytics Vidhya. SONAR is an abbreviated form of Sound Navigation and Ranging.
From Solo Notebooks to Collaborative Powerhouse: VS Code Extensions for Data Science and ML Teams Photo by Parabol | The Agile Meeting Toolbox on Unsplash In this article, we will explore the essential VS Code extensions that enhance productivity and collaboration for data scientists and machine learning (ML) engineers.
Making visualizations is one of the finest ways for data scientists to explain dataanalysis to people outside the business. Exploratorydataanalysis can help you comprehend your data better, which can aid in future data preprocessing. ExploratoryDataAnalysis What is EDA?
There are also plenty of data visualization libraries available that can handle exploration like Plotly, matplotlib, D3, Apache ECharts, Bokeh, etc. In this article, we’re going to cover 11 data exploration tools that are specifically designed for exploration and analysis.
From Predicting the behavior of a customer to automating many tasks, Machine learning has shown its capacity to convert raw data into actionable insights. Even though converting raw data into actionable insights, it is not determined by ML algorithms alone. The success of any ML project depends on a well-structured lifecycle.
And eCommerce companies have a ton of use cases where ML can help. The problem is, with more ML models and systems in production, you need to set up more infrastructure to reliably manage everything. And because of that, many companies decide to centralize this effort in an internal ML platform. But how to build it?
In fact, AI/ML graduate textbooks do not provide a clear and consistent description of the AI software engineering process. Therefore, I thought it would be helpful to give a complete description of the AI engineering process or AI Process, which is described in most AI/ML textbooks [5][6]. 85% or more of AI projects fail [1][2].
You should be comfortable working with data structures, algorithms, and libraries like NumPy, Pandas, and TensorFlow. DataAnalysis Skills : To work with LLMs effectively, you should be comfortable with dataanalysis techniques. If you found this article insightful, follow me on Linkedin and medium.
Kangas, developed by the team at Comet , is an open source tool that allows data developers to load, sort, group, and visualize millions of images at once without the risk of crashing their notebooks. Comet is an MLOps platform that offers a suite of tools for machine-learning experimentation and dataanalysis.
Introduction Welcome Back, Let's continue with our Data Science journey to create the Stock Price Prediction web application. This is part 2 of the three-series article. If you are here for the first time then please check out this article first. The data is in good shape. We will perform the following steps.
Once databases are added to your Snowflake account, they can be explored in Hex with the Data sources tab. ExploratoryDataAnalysis with Hex and Snowpark Using the Snowpark dataframe API, we can quickly explore the data. It’s possible to train ML models using the Snowpark UDF API, but it’s a more niche use case.
ExploratoryDataAnalysis(EDA)on Biological Data: A Hands-On Guide Unraveling the Structural Data of Proteins, Part II — ExploratoryDataAnalysis Photo from Pexels In a previous post, I covered the background of this protein structure resolution data set, including an explanation of key data terminology and details on how to acquire the data.
You have to learn only those parts of technology that are useful in data science as well as help you land a job. Don’t worry; you have landed at the right place; in this article, I will give you a crystal clear roadmap to learning data science. Because this is the only effective way to learn DataAnalysis.
a comprehensive approach to the ML pipeline. This session will explore the current state of model training and execution at the edge, as well as acceleration alternatives in data augmentation and data curation strategies, containerized models and applications. Guillaume Moutier|Sr.
To address this challenge, data scientists harness the power of machine learning to predict customer churn and develop strategies for customer retention. Continuous Experiment Tracking with Comet ML Comet ML is a versatile tool that helps data scientists optimize machine learning experiments.
I love cloudy and rainy weather, I usually stay at home on weekends when the weather is like this, read my articles that I added to my list during the week and plan for the next week. Well, when I look at my articles that I have shared, I am sharing my first article in 2023 with you. Hello everyone from a cloudy Sunday.
This article aims to guide readers in selecting the best AI and Machine Learning Courses to enhance their careers. Machine Learning (ML) is a subset of AI that involves using statistical techniques to enable machines to improve their performance on tasks through experience.
Machine Learning Operations (MLOps) can significantly accelerate how data scientists and ML engineers meet organizational needs. A well-implemented MLOps process not only expedites the transition from testing to production but also offers ownership, lineage, and historical data about ML artifacts used within the team.
Therefore, it mainly deals with unlabelled data. The ability of unsupervised learning to discover similarities and differences in data makes it ideal for conducting exploratorydataanalysis. It employs unsupervised learning to categorize articles on the same news story from different online news outlets.
Google, a tech powerhouse, offers insights into the upper echelons of ML salaries in the United States. In 2024, the significance of Machine Learning (ML) cannot be overstated. The global ML market is projected to soar from $26.03 It is vital to understand the salaries of Machine learning experts in India.
This article will guide you through effective strategies to learn Python for Data Science, covering essential resources, libraries, and practical applications to kickstart your journey in this thriving field. Its flexibility allows you to produce high-quality graphs and charts, making it perfect for exploratoryDataAnalysis.
The Art of Forecasting in the Retail Industry Part I : ExploratoryDataAnalysis & Time Series Analysis In this article, I will conduct exploratorydataanalysis and time series analysis using a dataset consisting of product sales in different categories from a store in the US between 2015 and 2018.
Data Science Project — Predictive Modeling on Biological Data Part III — A step-by-step guide on how to design a ML modeling pipeline with scikit-learn Functions. Photo by Unsplash Earlier we saw how to collect the data and how to perform exploratorydataanalysis. I hope you enjoyed this article.
We In this article, we will explore the following: Creating DataGrid with images. Adding bounding boxes Adding image masks Loading and visualizing image data from hugging face. We can visualize image data more efficiently, quickly, and with few lines of code without complicated functions and libraries. Adding image metadata.
By visually interpreting the performance metrics, it helps in the efficient evaluation of the ML models. In this article, you will learn various tools and techniques to visualize different models along with their Python implementation. For using Comet, you will need the API Key which you need to create on the Comel ML platform.
One such tool is HiPlot, a powerful data visualization library developed by Facebook: HiPlot is designed to help researchers, data scientists, and machine learning practitioners analyze and visualize complex datasets with ease. HiPlot can handle datasets with thousands of dimensions and is optimized for both speed and interactivity.
This is a straightforward and mostly clear-cut question — most of us can likely classify a dish as a dessert or not simply by reading its name, which makes it an excellent candidate for a simple ML model. The inferSchema parameter is set to True to infer the data types of the columns, and header is set to True to use the first row as headers.
But they need a lot of labeled training data, and the dataset could be biased. In this article, we’ll learn how to link Comet with Disneyland Sentiment Analysis. Another significant aspect of Comet is that it enables us to carry out exploratorydataanalysis. You can learn more about Comet here.
In this article, I will take you through what it’s like coding your own AI for the first time at the age of 16. This piece of data that my mentor found is called “ SemCor Corpus [5] ” (We access the dataset via NLTK’s SemcorCorpusReader [6] ) The reformatted version of the dataset looks something like this. Are you ready to explore?
Nevertheless, many data scientists will agree that they can be really valuable – if used well. And that’s what we’re going to focus on in this article, which is the second in my series on Software Patterns for Data Science & ML Engineering. Aside neptune.ai
In this article, we’ll showcase the ability of AI to improve the quality of the potential investment’s future performance, with a specific example from the real estate segment. In this article, we’ll first take a closer look at the concept of Real Estate Data Intelligence and the potential of AI to become a game changer in this niche.
In this blog, we’ll be using Python to perform exploratorydataanalysis (EDA) on a Netflix dataset that we’ve found on Kaggle. We’ll be using various Python libraries, including Pandas, Matplotlib, Seaborn, and Plotly, to visualize and analyze the data. Hope you enjoy this article. Thank you for reading!
In this article, we will be diving into the shopping world of Istanbul. Without further ado, let’s dive in to our study… Photograph Via : Steven Yu | Pexels, Pixabay Hello, my previous work Analyzing and Visualizing Earthquake Data Received with USGS API in Python Environment I prepared a new work after 3 weeks.
The purpose of this article is to introduce powerful alternatives for that common path, which are mainly suitable for mixed-data. Introduction Clustering Clustering is a fundamental technique in the field of machine learning that aims to group similar data points together based on their inherent characteristics or properties.
While there are a lot of benefits to using data pipelines, they’re not without limitations. Traditional exploratorydataanalysis is difficult to accomplish using pipelines given that the data transformations achieved at each step are overwritten by the proceeding step in the pipeline.
While there are a lot of benefits to using data pipelines, they’re not without limitations. Traditional exploratorydataanalysis is difficult to accomplish using pipelines given that the data transformations achieved at each step are overwritten by the proceeding step in the pipeline.
The article will be presented in 5 sections, which will be described as follows: Section 1: Brief description that acts as the motivating foundation of this research. Finally, thank you for reading this article. Section 2: Explanation of the ETL diagram for the project. If you would like to contact me.
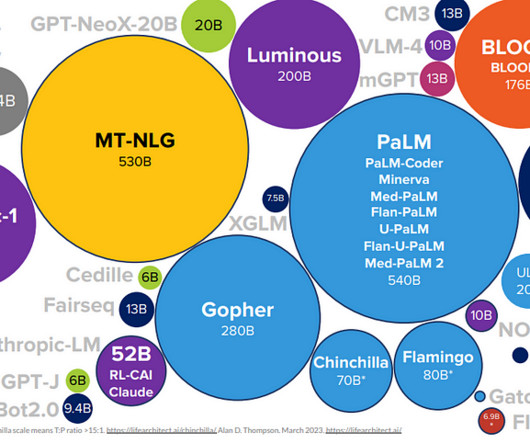
A small portion of the LLM ecosystem; image from scalevp.com In this article, we will provide a comprehensive guide to training, deploying, and improving LLMs. In this article, we will explore the essential steps involved in training LLMs, including data preparation, model selection, hyperparameter tuning, and fine-tuning.
Before we can feed this data into a computer for analysis, we must preprocess it. In this article, let’s dive deep into the Natural Language Toolkit (NLTK) data processing concepts for NLP data. This is an all-in-one article where you have learned. Visualizing data with Kangas.
As one engages in feature engineering and data cleaning, it is easy to forget that one needs to keep track of the changes to understand where improvements or declines in performance came from. In this article, I intend to show how someone can keep track of changes with Comet ML’s dataset storage feature: Artifacts. Let’s begin.
What is the objective of this article? Data visualization is an indispensable aspect of any data science project, playing a pivotal role in gaining insights and communicating findings effectively. What is data visualization? Why do we choose Python data visualization tools for our projects? Introduction 1.1
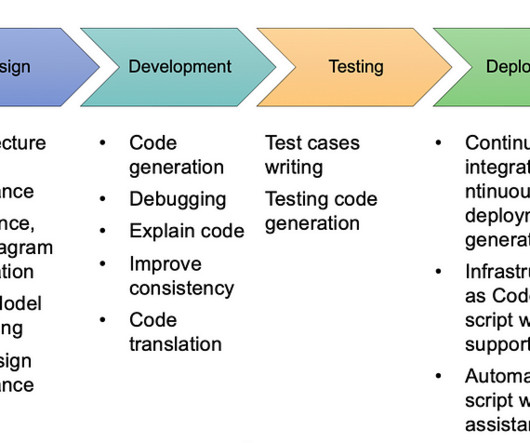
Increase your productivity in software development with Generative AI As I mentioned in Generative AI use case article, we are seeing AI-assisted developers. I include some reference for this field in that article, but as time goes by, it is necessary to dedicate a particular article to survey this field in-depth.
Photo by Stefany Andrade on Unsplash Dealing with Box Plots, Violin Plots and Contour Plots reveals a lot about Data before Machine Learning Modeling, Welcome back to the wrap up article for the prerequisites of ML modeling. Now, we can continue with the rest of the concepts in this article.
Uncomfortable reality: In the era of large language models (LLMs) and AutoML, traditional skills like Python scripting, SQL, and building predictive models are no longer enough for data scientist to remain competitive in the market. Coding skills remain important, but the real value of data scientists today is shifting. It depends.
We organize all of the trending information in your field so you don't have to. Join 17,000+ users and stay up to date on the latest articles your peers are reading.
You know about us, now we want to get to know you!
Let's personalize your content
Let's get even more personalized
We recognize your account from another site in our network, please click 'Send Email' below to continue with verifying your account and setting a password.


Let's personalize your content