This site uses cookies to improve your experience. To help us insure we adhere to various privacy regulations, please select your country/region of residence. If you do not select a country, we will assume you are from the United States. Select your Cookie Settings or view our Privacy Policy and Terms of Use.
Cookie Settings
Cookies and similar technologies are used on this website for proper function of the website, for tracking performance analytics and for marketing purposes. We and some of our third-party providers may use cookie data for various purposes. Please review the cookie settings below and choose your preference.
Used for the proper function of the website
Used for monitoring website traffic and interactions
Cookie Settings
Cookies and similar technologies are used on this website for proper function of the website, for tracking performance analytics and for marketing purposes. We and some of our third-party providers may use cookie data for various purposes. Please review the cookie settings below and choose your preference.
Strictly Necessary: Used for the proper function of the website
Performance/Analytics: Used for monitoring website traffic and interactions
ArticleVideo Book This article was published as a part of the Data Science Blogathon. The post Classifying DDoS attacks with ArtificialIntelligence appeared first on Analytics Vidhya. Introduction The majority of corporates or services rely highly upon.
Introduction ArtificialIntelligence revolutionizes various fields such as networking, multi-dimensional data exploration, genomics, and sensor data analysis, increasing the demand for advanced datavisualization tools.
Introduction Data Science and ArtificialIntelligence (AI) are two of the most rapidly growing and exciting technological fields today. Both disciplines are revolutionizing how we process, analyze, and make sense of data to solve complex problems and make informed decisions.
This article will dive into ggplot’s features and why it’s such a valuable tool for visualizingdata […] The post ggplot in Python: A DataVisualization Guide appeared first on Analytics Vidhya. Built on the grammar of graphics, ggplot offers a straightforward way to make beautiful plots.
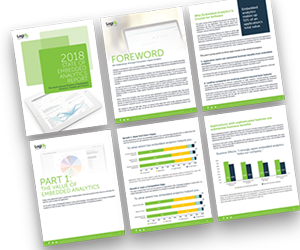
Why do some embedded analytics projects succeed while others fail? We surveyed 500+ application teams embedding analytics to find out which analytics features actually move the needle. Read the 6th annual State of Embedded Analytics Report to discover new best practices. Brought to you by Logi Analytics.
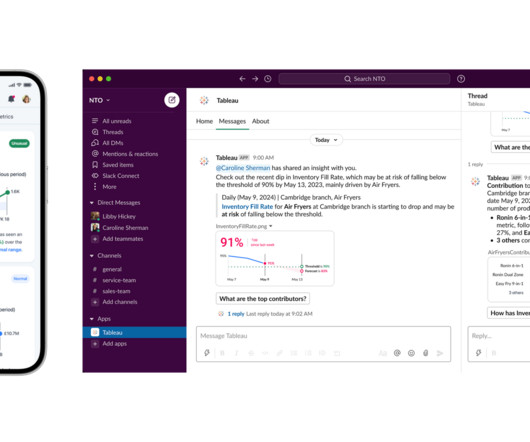
Introduction Tableau, a powerful datavisualization tool, can sometimes leave users with lingering questions. What’s the best way to display this data? Tableau tackles these issues head-on by leveraging artificialintelligence. Am I missing any key insights?
That’s why businesses of all types and sizes are embracing datavisualization, albeit often with a simplified approach. Power BI and Tableau, popular and user-friendly datavisualization tools, help businesses organize large datasets.
ArticleVideo Book Introduction to ArtificialIntelligence and Machine Learning ArtificialIntelligence (AI) and its sub-field Machine Learning (ML) have taken the world by storm. The post A Comprehensive Step-by-Step Guide to Become an Industry Ready Data Science Professional appeared first on Analytics Vidhya.
We would like to talk about datavisualization and its role in the big data movement. Data is useless without the opportunity to visualize what we are looking for. As we have already said, the challenge for companies is to extract value from data, and to do so it is necessary to have the best visualization tools.
Top data science conferences 2023 in different regions of the world 1. AAAI Conference on ArtificialIntelligence – Washington DC, United States The AAAI Conference on ArtificialIntelligence (AAAI) is a leading conference in the field of artificialintelligence research.
Introduction Generative AI in forensic science involves applying artificialintelligence techniques to generate data, images, or other forensic evidence-related information.
Introduction Tableau is a powerful datavisualization tool that is crucial in Data Science. Its significance lies in its ability to transform complex data into easily understandable visualizations, aiding in better decision-making processes.
In a tweet that sent ripples through the data science community, Elon Musk , the visionary CEO of SpaceX and Tesla, recently unveiled a revolutionary train artificialintelligence bot. The tweet, posted on July 15, 2023, has sparked immense interest and excitement among data scientists worldwide.
LangChain agents are a type of artificialintelligence that can be used to build AI applications. They are based on large language models (LLMs), which are a type of artificialintelligence that can generate and understand human language. Key learning outcomes: What are embeddings and how do they work?
Introduction Python is a versatile and powerful programming language that plays a central role in the toolkit of data scientists and analysts. Its simplicity and readability make it a preferred choice for working with data, from the most fundamental tasks to cutting-edge artificialintelligence and machine learning.
Introduction Artificialintelligence (AI) is one of the fastest-growing areas of technology, and AI engineers are at the forefront of this revolution. These professionals are responsible for the design and development of AI systems, including machine learning algorithms, computer vision, natural language processing, and robotics.
Introduction to ArtificialIntelligence and Machine Learning ArtificialIntelligence (AI) and its sub-field Machine Learning (ML) have taken the world by storm. The post A Comprehensive Step-by-Step Guide to Become an Industry-Ready Data Science Professional appeared first on Analytics Vidhya.
This instructor-led live training course is designed for individuals who want to learn how to use Python to perform data analysis, visualization, and manipulation. Python is a powerful programming language used in data science, machine learning, and artificialintelligence.
This is why conferences that revolve around ArtificialIntelligence (AI) are great for developers, analysts and students who wish to work with AI (build or incorporate). Introduction Getting to meet and interact with people from your domain is always a great feeling.
Introduction Tableau is a powerful datavisualization tool that allows users to analyze and present data interactively and meaningfully. It helps businesses make data-driven decisions by providing easy-to-understand insights and visualizations.
This article was published as a part of the Data Science Blogathon. Introduction Text Mining is also known as Text Data Mining or Text Analytics or is an artificialintelligence (AI) technology that uses natural language processing (NLP) to extract essential data from standard language text.
Introduction Analytics Vidhya DataHour is designed to provide valuable insights and knowledge to individuals looking to build a career in the data-tech industry. These sessions cover a wide range of topics, from the fields of artificialintelligence, and machine learning, and various topics related to data science.
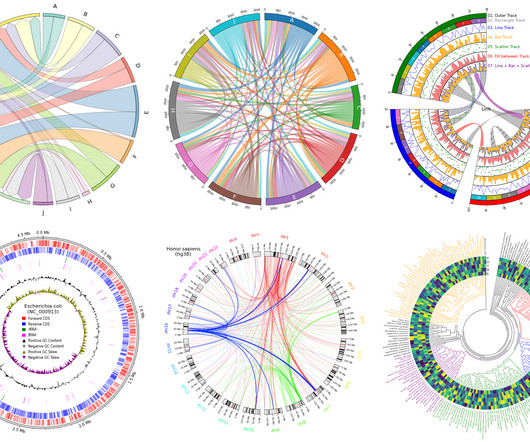
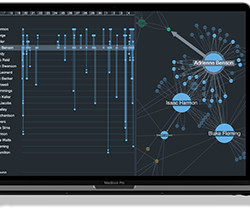
Recently, we spoke with Elijah Meeks, datavisualization expert and Chief Innovation Officer at Noteable about complex datavisualizations and their uses. What is complex datavisualization? I think that that’s one of the reasons why people are so nervous about leveraging complex datavisualization.
These skills include programming languages such as Python and R, statistics and probability, machine learning, datavisualization, and data modeling. Data preparation is an essential step in the data science workflow, and data scientists should be familiar with various data preparation tools and best practices.
While this basic model still applies to enterprise fraud management today, the increasing use of artificialintelligence – by both fraudsters and fraud prevention teams – introduces new complexities. The post Enterprise fraud management, AI and datavisualization appeared first on Cambridge Intelligence.
Introduction Geographic datavisualization is a field that merges data analysis with geographic mapping to unveil patterns, trends, and insights across geographical locations.
Data analysis tools have improbably morphed into the modern journalist’s pen and paper, uncovering stories that might otherwise remain hidden in plain sight. A data set, for instance, could reveal patterns of social inequality, political shifts, or the rumblings of an impending economic change.
AI-powered automation speeds things up, and machine learning improves foresight, but datavisualization is key to an analyst’s control over their supply chain. In this blog post, you’ll find out how to transform your supply chain processes by integrating graph and timeline visualization with the latest AI-led supply chain tools.
GPTs for Data science are the next step towards innovation in various data-related tasks. These are platforms that integrate the field of data analytics with artificialintelligence (AI) and machine learning (ML) solutions. You can upload your data files to this GPT that it can then analyze.
Artificialintelligence is changing the way organizations think about data analysis. AI and datavisualization can do a lot of the heavy lifting for analysts and investigators working with connected data – helping them detect, understand and even predict risks and threats.
Their research can lead to breakthroughs in fields such as artificialintelligence, machine learning, and cybersecurity, which are essential for the progress of modern society. DataVisualization Techniques: Ability to transform complex data into understandable graphs and charts.
The emergence of ArtificialIntelligence in every field is reflected by the rise of its worth in the global market. The global market for artificialintelligence (AI) was worth USD 454.12 The global market for artificialintelligence (AI) was worth USD 454.12 billion by 2032. billion by 2032.
Not only is datavisualization a powerful tool that allows data scientists and analysts to communicate complex insights and findings in an easily digestible format, but it’s also one of the first steps for aspiring data scientists/analysts who want to enter the field and showcase newly learned skills.
Many rely on graph technology and healthcare datavisualization for this because it’s powerful, it’s accessible, and its advanced algorithms help analysts to identify, investigate and predict fraud. The artificialintelligence revolution introduces new models trained for complex tasks and in-depth analysis.
The program’s curriculum includes modules in machine learning and deep learning and artificialintelligence. Thinkful Data Science Bootcamp Delivery Format : Online Tuition : $16,950 Duration : 6 months Thinkful Data Science Bootcamp Thinkful offers a data science boot camp that is both affordable and comprehensive.
OpenAI announced the launch of its most recent advancement in artificialintelligence, a sophisticated large language model named GPT-4o. Voice-driven datavisualization feedback With its vision and voice functionalities, GPT-4o can assist professionals in analyzing complex datavisualizations by providing spoken feedback.
Be sure to check out his talk, “ A Practical Introduction to DataVisualization for Data Scientists ,” there! There are many ways to create visualizations, between chart choosers, chart wizards, GUI-based tools of various flavors, and of course, many libraries if you’re looking to use code.
Datavisualization tools turn insights and data into something understandable, especially for non-data stakeholders who may not share the same skillsets as the team who’s behind the data. So let’s take a look at seven trending datavisualization tools that have gotten quite a bit of attention on GitHub this year.
degree, acquiring specific valuable skills can come in handier in kickstarting your data science career. 3. Data scientists will be replaced by artificialintelligence As artificialintelligence advances, a common misconception arises that AI will replace all human intelligent labor.
In the world of datavisualization , the ability to produce material that can speak to your audience, regardless of their technical expertise, is an ever-important factor to consider. Tableau Public Tableau Public , a powerful datavisualization software, empowers users to create interactive and shareable dashboards with ease.
Overlaying AI-generated data enhances the effectiveness of graph visualizations and reveals an attack path inside the cloud network FREE: Graph visualization and artificialintelligence white paper Find out how successful businesses work with the latest graph visualization and AI technologies to make fast, business-critical decisions.
These methods can help businesses to make sense of their data and to identify trends and patterns that would otherwise be invisible. In recent years, there has been a growing interest in the use of artificialintelligence (AI) for data analysis. It has a wide range of datavisualization tools.
Data science bootcamps are intensive short-term educational programs designed to equip individuals with the skills needed to enter or advance in the field of data science. They cover a wide range of topics, ranging from Python, R, and statistics to machine learning and datavisualization.
We organize all of the trending information in your field so you don't have to. Join 17,000+ users and stay up to date on the latest articles your peers are reading.
You know about us, now we want to get to know you!
Let's personalize your content
Let's get even more personalized
We recognize your account from another site in our network, please click 'Send Email' below to continue with verifying your account and setting a password.


Let's personalize your content