This site uses cookies to improve your experience. To help us insure we adhere to various privacy regulations, please select your country/region of residence. If you do not select a country, we will assume you are from the United States. Select your Cookie Settings or view our Privacy Policy and Terms of Use.
Cookie Settings
Cookies and similar technologies are used on this website for proper function of the website, for tracking performance analytics and for marketing purposes. We and some of our third-party providers may use cookie data for various purposes. Please review the cookie settings below and choose your preference.
Used for the proper function of the website
Used for monitoring website traffic and interactions
Cookie Settings
Cookies and similar technologies are used on this website for proper function of the website, for tracking performance analytics and for marketing purposes. We and some of our third-party providers may use cookie data for various purposes. Please review the cookie settings below and choose your preference.
Strictly Necessary: Used for the proper function of the website
Performance/Analytics: Used for monitoring website traffic and interactions
PowerBI and Tableau, popular and user-friendly data visualization tools, help businesses organize large datasets. While both software are crucial for efficient data organization, comparing Power […] The post PowerBI vs Tableau: Similarities and Differences appeared first on Analytics Vidhya.
Introduction Welcome, data enthusiasts and aspiring PowerBI professionals! If you’re gearing up for a PowerBI interview, you’re probably aware of the dynamic nature of the business intelligence world.
ArticleVideo Book This article was published as a part of the Data Science Blogathon Introduction Natural Language Processing (NLP) is a subpart of ArtificialIntelligence. The post Interesting NLP Use Cases Every Data Science Enthusiast should know! appeared first on Analytics Vidhya.
Introduction Intelligent document processing (IDP) is a technology that uses artificialintelligence (AI) and machine learning (ML) to automatically extract information from unstructured documents such as invoices, receipts, and forms.
These sessions cover a wide range of topics, from the fields of artificialintelligence, and machine learning, and various topics related to data science. Introduction Analytics Vidhya DataHour is designed to provide valuable insights and knowledge to individuals looking to build a career in the data-tech industry.
Microsoft Fabric combines multiple elements into a single platform – Image courtesy of Microsoft The contribution of PowerBI The integration of Microsoft PowerBI and Microsoft Fabric offers a powerful combination for organizations seeking comprehensive data analytics and insights.
Summary : Microsoft Fabric is an end-to-end Data Analytics platform designed for integration, processing, and advanced insights, while PowerBI excels in creating interactive visualisations and reports. Key Takeaways Microsoft Fabric is a full-scale data platform, while PowerBI focuses on visualising insights.
Summary: In PowerBI, slicers and filters serve distinct purposes. PowerBI has emerged as a leading tool for data visualisation and business intelligence, allowing users to transform raw data into actionable insights. What are Slicers in PowerBI? What are Filters in PowerBI?
The Datamarts capability opens endless possibilities for organizations to achieve their data analytics goals on the PowerBI platform. Before we look into the PowerBI Datamarts, let us take a step back and understand the meaning of a Datamart. What is PowerBI Datamarts?
Summary: PowerBI alternatives like Tableau, Qlik Sense, and Zoho Analytics provide businesses with tailored Data Analysis and Visualisation solutions. Introduction PowerBI has become one of the most popular business intelligence (BI) tools, offering powerful Data Visualisation, reporting, and decision-making features.
Summary: Data Visualisation is crucial to ensure effective representation of insights tableau vs powerbi are two popular tools for this. This article compares Tableau and PowerBI, examining their features, pricing, and suitability for different organisations. What is PowerBI? billion in 2023.
These are platforms that integrate the field of data analytics with artificialintelligence (AI) and machine learning (ML) solutions. PowerBI Wizard It is a popular business intelligence tool that empowers you to explore data. What is OpenAI’s GPT Store?
Besides, there is a balance between the precision of traditional data analysis and the innovative potential of explainable artificialintelligence. Machine learning allows an explainable artificialintelligence system to learn and change to achieve improved performance in highly dynamic and complex settings.
In this era of information overload, utilizing the power of data and technology has become paramount to drive effective decision-making. Decision intelligence is an innovative approach that blends the realms of data analysis, artificialintelligence, and human judgment to empower businesses with actionable insights.
However, we collect these over time and will make trends secure, for example how the demand for Python, SQL or specific tools such as dbt or PowerBI changes. The presentation is currently limited to the current situation on the labor market. Why we did it? It is a nice show-case many people are interested in.
Dashboards, such as those built using Tableau or PowerBI , provide real-time visualizations that help track key performance indicators (KPIs). They interpret data using tools like Excel, Tableau, or PowerBI and work closely with stakeholders to align data findings with business objectives.
The application of Artificialintelligence and Business Intelligence in affiliate marketing has been actively discussed for quite a time. In this way, BI carries out its mission – to simplify marketers’ work with data. ArtificialIntelligence. billion by 2022.
Also, it is expected that the integration of BI solutions with any third-party services will be more seamless. Augmented analytics uses artificialintelligence to process data and prepare insights based on them. Here we present an overview of some of them: Microsoft PowerBI. Automation & Augmented Analytics.
ArtificialIntelligence (AI) ersetzt. Cloud Computing , erst mit den Infrastructure as a Service (IaaS) Angeboten von Amazon, Microsoft und Google, wurde zum Enabler für schnelle, flexible Big Data Architekturen. 2 Denn heute spielt die Definition darüber, was Big Data eigentlich genau ist, wirklich keine Rolle mehr.
These are platforms that integrate the field of data analytics with artificialintelligence (AI) and machine learning (ML) solutions. PowerBI Wizard It is a popular business intelligence tool that empowers you to explore data. What is OpenAI’s GPT Store?
Introduction The world is transforming by AI, ML, Blockchain, and Data Science drastically, and hence its community is growing rapidly. So, to provide our community with the knowledge they need to master these domains, Analytics Vidhya has launched its DataHour sessions.
More and more often, businesses are using data to drive their decisions — which makes cutting-edge analytics and business intelligence strategies one of the best advantages a company can have. Here are the six trends you should be aware of that will reshape business intelligence in 2020 and throughout the new decade.
Tools like Tableau, PowerBI, and Python libraries such as Matplotlib and Seaborn are commonly taught. ArtificialIntelligence : Concepts of AI include neural networks, natural language processing (NLP), and reinforcement learning. R : Often used for statistical analysis and data visualization.
AI-powered features in Excel enable users to make data-driven decisions more efficiently, saving time and effort while uncovering valuable insights hidden within large datasets. Introduction ArtificialIntelligence (AI) is revolutionising how we use Excel, making data management faster and more efficient. What is AI in Excel?
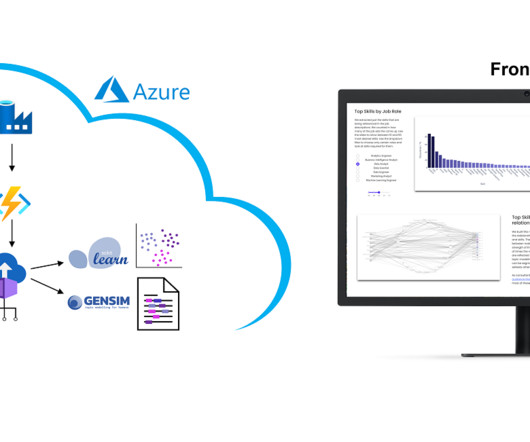
The consumer can create a “Python script” connection in Microsoft PowerBI and start creating BI reports for further BI analysis on data products. When the Python script runs in PowerBI, the user authenticates themselves to the server by using the JSON string shared with them during data product delivery.
Popular tools like PowerBI, Tableau, and Google Data Studio offer unique features for Data Analysis. Common tools like Tableau, PowerBI, and Google Data Studio enable businesses to create dynamic visualisations that simplify complex datasets. These visual representations help users quickly identify trends and patterns.
Nevertheless, process mining can be considered a sub-discipline of business intelligence. It is therefore hardly surprising that some process mining tools are actually just a plugin for PowerBI, Tableau or Qlik.
Visualisation tools like PowerBI (Azure) and Looker (GCP) offer intuitive reporting interfaces, while AWS integrates Tableau for diverse visualisation needs. Toolset Comparison For analytics, AWSs Redshift and GCPs BigQuery excel in handling massive datasets, while Azure Synapse Analytics provides an integrated approach.
This business intelligence project transforms raw data into actionable insights, amplifying data-driven lending practices. Global health expenditure analysis The global health expenditure analysis project harnesses clustering analysis through PowerBI and PyCaret.
Expertise in tools like PowerBI, SQL, and Python is crucial. Expertise in programs like Microsoft Excel, SQL , and business intelligence (BI) tools like PowerBI or Tableau allows analysts to process and visualise data efficiently. AI and automation play a central role in the evolving role.
Overview: Data science vs data analytics Think of data science as the overarching umbrella that covers a wide range of tasks performed to find patterns in large datasets, structure data for use, train machine learning models and develop artificialintelligence (AI) applications.
Microsoft PowerBI Microsoft PowerBI is almost synonymous with comprehensive business intelligence capabilities. Like Tabeau, its no-code functionality combined with AI-enhanced features can help users bring out most of their data.
PowerBIPowerBI is a business analytics tool that allows researchers to create interactive dashboards and reports. ArtificialIntelligence Integrating AI and machine learning techniques into bioinformatics is a challenge. It is useful for visualising complex data and identifying patterns and trends.
Technological developments like ArtificialIntelligence and Machine Learning have paved the way for businesses to achieve higher rates of success. Python programming, Python libraries , machine learning, ArtificialIntelligence, and statistics are all included.
But what many might not know is how Cognos Analytics has seamlessly integrated artificialintelligence (AI) to revolutionize users’ BI experience. Cognos Analytics has already positioned itself as the leader in AI-poweredBI. IBM’s vision for BI 3.0, But the future is even more exciting.
Data Visualization and Business Intelligence Tableau Tableau has revolutionized data visualization, offering a user-friendly platform for creating interactive dashboards and reports. PowerBI Microsoft’s PowerBI is another popular business intelligence tool, known for its integration with the broader Microsoft ecosystem.
Introduction ArtificialIntelligence (AI) and Machine Learning are revolutionising industries by enabling smarter decision-making and automation. Understanding AI and Machine Learning ArtificialIntelligence (AI) is the simulation of human intelligence in machines designed to think and act like humans.
This can be applied to data visualization tools such as PowerBI and others. With many positions that you’ll apply for they most often will request that you have a specific level of knowledge with one or the other. So when you apply and it asks for experience in Python, don’t highlight your R skills.
This could involve using tools like Tableau or PowerBI to create visualizations and dashboards. This could involve using tools like Apache Spark or Apache Flink to perform data transformations, analytics, and machine learning. Analyze the data : After processing the data, you need to analyze it to gain insights and make decisions.
CBRE is unlocking the potential of artificialintelligence (AI) to realize value across the entire commercial real estate lifecycle—from guiding investment decisions to managing buildings. Services range from financing and investment to property management.
Because they are the most likely to communicate data insights, they’ll also need to know SQL, and visualization tools such as PowerBI and Tableau as well. Some of the tools and techniques unique to business analysts are pivot tables, financial modeling in Excel, PowerBI Dashboards for forecasting, and Tableau for similar purposes.
One set of tools that are becoming more important in our data-driven world is BI tools. Think of Tableau, PowerBI, and QlikView. This allows for it to be integrated with many different tools and technologies to improve data management and analysis workflows.
ArtificialIntelligence (AI) and Machine Learning ArtificialIntelligence (AI) and Machine Learning are at the forefront of enhancing analytical capabilities. Popular tools like Tableau and PowerBI empower users to create interactive dashboards, allowing real-time data exploration.
Data Analytics Platforms: Tableau, PowerBI, Looker, Alteryx, Google Analytics, SPSS, SAP, Pandas. The most common trend shouldn’t come as a surprise, as the most in-demand data analytics platforms revolve around reporting, such as Tableau, PowerBI, Looker, Alteryx, Google Analytics, SPSS, and SAP.
We organize all of the trending information in your field so you don't have to. Join 17,000+ users and stay up to date on the latest articles your peers are reading.
You know about us, now we want to get to know you!
Let's personalize your content
Let's get even more personalized
We recognize your account from another site in our network, please click 'Send Email' below to continue with verifying your account and setting a password.


Let's personalize your content