This site uses cookies to improve your experience. To help us insure we adhere to various privacy regulations, please select your country/region of residence. If you do not select a country, we will assume you are from the United States. Select your Cookie Settings or view our Privacy Policy and Terms of Use.
Cookie Settings
Cookies and similar technologies are used on this website for proper function of the website, for tracking performance analytics and for marketing purposes. We and some of our third-party providers may use cookie data for various purposes. Please review the cookie settings below and choose your preference.
Used for the proper function of the website
Used for monitoring website traffic and interactions
Cookie Settings
Cookies and similar technologies are used on this website for proper function of the website, for tracking performance analytics and for marketing purposes. We and some of our third-party providers may use cookie data for various purposes. Please review the cookie settings below and choose your preference.
Strictly Necessary: Used for the proper function of the website
Performance/Analytics: Used for monitoring website traffic and interactions
Microsoft Fabric combines multiple elements into a single platform – Image courtesy of Microsoft The contribution of PowerBI The integration of Microsoft PowerBI and Microsoft Fabric offers a powerful combination for organizations seeking comprehensive data analytics and insights.
Summary : Microsoft Fabric is an end-to-end Data Analytics platform designed for integration, processing, and advanced insights, while PowerBI excels in creating interactive visualisations and reports. Key Takeaways Microsoft Fabric is a full-scale data platform, while PowerBI focuses on visualising insights.
Summary: PowerBI alternatives like Tableau, Qlik Sense, and Zoho Analytics provide businesses with tailored Data Analysis and Visualisation solutions. Introduction PowerBI has become one of the most popular business intelligence (BI) tools, offering powerful Data Visualisation, reporting, and decision-making features.
The Datamarts capability opens endless possibilities for organizations to achieve their data analytics goals on the PowerBI platform. Before we look into the PowerBI Datamarts, let us take a step back and understand the meaning of a Datamart. What is PowerBI Datamarts?
Summary: PowerBI is a business intelligence tool that transforms raw data into actionable insights. PowerBI enhances decision-making by providing interactive dashboards and reports that are accessible to both technical and non-technical users. What Is PowerBI?
Summary: Data Visualisation is crucial to ensure effective representation of insights tableau vs powerbi are two popular tools for this. This article compares Tableau and PowerBI, examining their features, pricing, and suitability for different organisations. What is PowerBI? billion in 2023.
Though both are great to learn, what gets left out of the conversation is a simple yet powerful programming language that everyone in the data science world can agree on, SQL. But why is SQL, or Structured Query Language , so important to learn? Let’s start with the first clause often learned by new SQL users, the WHERE clause.
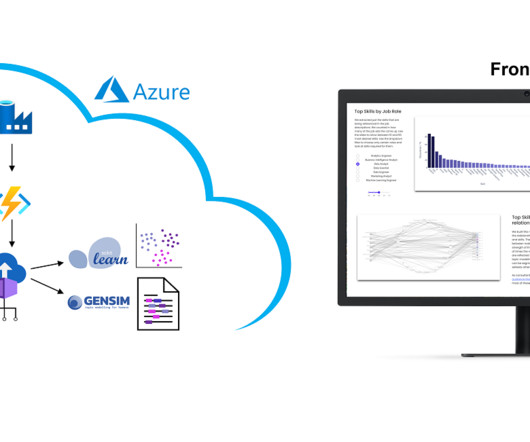
However, we collect these over time and will make trends secure, for example how the demand for Python, SQL or specific tools such as dbt or PowerBI changes. The presentation is currently limited to the current situation on the labor market. Why we did it? It is a nice show-case many people are interested in.
Dashboards, such as those built using Tableau or PowerBI , provide real-time visualizations that help track key performance indicators (KPIs). Descriptive analytics is a fundamental method that summarizes past data using tools like Excel or SQL to generate reports. Data Scientists require a robust technical foundation.
Tools like Tableau, PowerBI, and Python libraries such as Matplotlib and Seaborn are commonly taught. Databases and SQL : Managing and querying relational databases using SQL, as well as working with NoSQL databases like MongoDB. R : Often used for statistical analysis and data visualization.
CBRE is unlocking the potential of artificialintelligence (AI) to realize value across the entire commercial real estate lifecycle—from guiding investment decisions to managing buildings. The wrapper function creates a dynamic prompt template and generates a SQL query using Anthropic Claude 2.
Example Event Log for Process Mining The following example SQL-query is inserting Event-Activities from a SAP ERP System into an existing event log database table. Nevertheless, process mining can be considered a sub-discipline of business intelligence. It is based on a German SAP ERP configuration with customized processes.
Introduction The world is transforming by AI, ML, Blockchain, and Data Science drastically, and hence its community is growing rapidly. So, to provide our community with the knowledge they need to master these domains, Analytics Vidhya has launched its DataHour sessions.
Expertise in tools like PowerBI, SQL, and Python is crucial. Expertise in programs like Microsoft Excel, SQL , and business intelligence (BI) tools like PowerBI or Tableau allows analysts to process and visualise data efficiently. AI and automation play a central role in the evolving role.
Overview: Data science vs data analytics Think of data science as the overarching umbrella that covers a wide range of tasks performed to find patterns in large datasets, structure data for use, train machine learning models and develop artificialintelligence (AI) applications.
Popular tools like PowerBI, Tableau, and Google Data Studio offer unique features for Data Analysis. Common tools like Tableau, PowerBI, and Google Data Studio enable businesses to create dynamic visualisations that simplify complex datasets. These visual representations help users quickly identify trends and patterns.
Data Analytics Platforms: Tableau, PowerBI, Looker, Alteryx, Google Analytics, SPSS, SAP, Pandas. The most common trend shouldn’t come as a surprise, as the most in-demand data analytics platforms revolve around reporting, such as Tableau, PowerBI, Looker, Alteryx, Google Analytics, SPSS, and SAP.
With expertise in programming languages like Python , Java , SQL, and knowledge of big data technologies like Hadoop and Spark, data engineers optimize pipelines for data scientists and analysts to access valuable insights efficiently. Excel, Tableau, PowerBI, SQL Server, MySQL, Google Analytics, etc.
Introduction ArtificialIntelligence (AI) and Machine Learning are revolutionising industries by enabling smarter decision-making and automation. Understanding AI and Machine Learning ArtificialIntelligence (AI) is the simulation of human intelligence in machines designed to think and act like humans.
Skills Develop proficiency in programming languages like Python , R, and SQL. PowerBIPowerBI is a business analytics tool that allows researchers to create interactive dashboards and reports. ArtificialIntelligence Integrating AI and machine learning techniques into bioinformatics is a challenge.
It covers essential topics such as SQL queries, data visualization, statistical analysis, machine learning concepts, and data manipulation techniques. Key Takeaways SQL Mastery: Understand SQL’s importance, join tables, and distinguish between SELECT and SELECT DISTINCT. How do you join tables in SQL?
Because they are the most likely to communicate data insights, they’ll also need to know SQL, and visualization tools such as PowerBI and Tableau as well. Some of the tools you can expect to see used will be PowerBI and Tableau Data Architect Before you ask, yes a data architect and a data engineer are quite different.
The rise of advanced technologies such as ArtificialIntelligence (AI), Machine Learning (ML) , and Big Data analytics is reshaping industries and creating new opportunities for Data Scientists. Focus on Python and R for Data Analysis, along with SQL for database management. Here are five key trends to watch.
Here are some of the most essential elements of Data Science: Machine Learning (ML): Helps computers learn from data and make predictions without direct programming; powers recommendation systems like those on Netflix or Amazon. SQL : A database language to fetch and analyse data.
Though SQL is decades old and is still the “go-to” when it comes to the management of unstructured data, it doesn’t mean that you should neglect your other skills. That’s because by avoiding these common mistakes, aspiring data scientists can give themselves the best chance of success in this exciting and constantly evolving field.
Starting with these basics enables a smoother transition to more specialised topics, such as Data Visualisation, Big Data Analysis , and ArtificialIntelligence. Key Features Nine-Course Structure : Covers everything from basic Data Science concepts to advanced SQL and Python. Data Science Course by Pickl.AI
Technologies such as machine learning and artificialintelligence are being integrated into Data Analysis, allowing analysts to predict trends and identify potential issues before they arise. Proficiency in tools such as Excel, SQL, and business intelligence platforms can significantly enhance their effectiveness.
You can work on web development, mobile app development, desktop application development, or even specialize in areas like game development or ArtificialIntelligence. They gather, clean, analyze, and visualize data using tools like Excel, SQL, and data visualization software. Why Pursue a Course in Data Science?
Understanding the differences between SQL and NoSQL databases is crucial for students. Visualisation Tools Familiarity with tools such as Tableau, PowerBI, and D3.js Future Trends Exploring emerging trends in Big Data, such as the rise of edge computing, quantum computing, and advancements in artificialintelligence.
A legacy data stack usually refers to the traditional relational database management system (RDBMS), which uses a structured query language (SQL) to store and process data. SQL, however, remains a popular query language for both legacy and modern data stacks. Examples of BI tools include Looker, PowerBI , and Tableau.
You should be skilled in programming languages such as Python, R, or SQL , which are commonly used for data manipulation and analysis. Azure Synapse Analytics Previously known as Azure SQL Data Warehouse , Azure Synapse Analytics offers a limitless analytics service that combines big data and data warehousing.
While knowing Python, R, and SQL is expected, youll need to go beyond that. Similar to previous years, SQL is still the second most popular skill, as its used for many backend processes and core skills in computer science and programming. Employers arent just looking for people who can program.
We organize all of the trending information in your field so you don't have to. Join 17,000+ users and stay up to date on the latest articles your peers are reading.
You know about us, now we want to get to know you!
Let's personalize your content
Let's get even more personalized
We recognize your account from another site in our network, please click 'Send Email' below to continue with verifying your account and setting a password.


Let's personalize your content