This site uses cookies to improve your experience. To help us insure we adhere to various privacy regulations, please select your country/region of residence. If you do not select a country, we will assume you are from the United States. Select your Cookie Settings or view our Privacy Policy and Terms of Use.
Cookie Settings
Cookies and similar technologies are used on this website for proper function of the website, for tracking performance analytics and for marketing purposes. We and some of our third-party providers may use cookie data for various purposes. Please review the cookie settings below and choose your preference.
Used for the proper function of the website
Used for monitoring website traffic and interactions
Cookie Settings
Cookies and similar technologies are used on this website for proper function of the website, for tracking performance analytics and for marketing purposes. We and some of our third-party providers may use cookie data for various purposes. Please review the cookie settings below and choose your preference.
Strictly Necessary: Used for the proper function of the website
Performance/Analytics: Used for monitoring website traffic and interactions
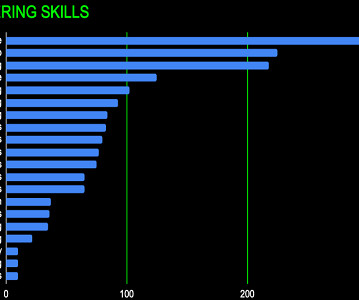
Data Storage and Management Once data have been collected from the sources, they must be secured and made accessible. The responsibilities of this phase can be handled with traditional databases (MySQL, PostgreSQL), cloud storage (AWS S3, Google Cloud Storage), and big data frameworks (Hadoop, Apache Spark).
Analytics and Data Analysis Coming in as the 4th most sought-after skill is data analytics, as many data scientists will be expected to do some analysis in their careers. This doesn’t mean anything too complicated, but could range from basic Excel work to more advanced reporting to be used for datavisualization later on.
As you’ll see below, however, a growing number of data analytics platforms, skills, and frameworks have altered the traditional view of what a data analyst is. Data Presentation: Communication Skills, DataVisualization Any good data analyst can go beyond just number crunching.
Goal The objective of this post is to demonstrate how Polars performance is much better than other open-source libraries in a variety of data analysis tasks, such as data cleaning, datawrangling, and datavisualization. ? Contributions welcome ! ?Acknowledgments
Descriptive Analytics Projects: These projects focus on summarizing historical data to gain insights into past trends and patterns. Examples include generating reports, dashboards, and datavisualizations to understand business performance, customer behavior, or operational efficiency.
Data science methodologies and skills can be leveraged to design these experiments, analyze results, and iteratively improve prompt strategies. Using skills such as statistical analysis and datavisualization techniques, prompt engineers can assess the effectiveness of different prompts and understand patterns in the responses.
Here are some details about these packages: jupyterlab is for model building and data exploration. matplotlib is for datavisualization. missingno is for missing values visualization. In your new virtual environment, install the following packages (which include libraries and dependencies): pip3 install jupyterlab==3.4.3
We organize all of the trending information in your field so you don't have to. Join 17,000+ users and stay up to date on the latest articles your peers are reading.
You know about us, now we want to get to know you!
Let's personalize your content
Let's get even more personalized
We recognize your account from another site in our network, please click 'Send Email' below to continue with verifying your account and setting a password.


Let's personalize your content