This site uses cookies to improve your experience. To help us insure we adhere to various privacy regulations, please select your country/region of residence. If you do not select a country, we will assume you are from the United States. Select your Cookie Settings or view our Privacy Policy and Terms of Use.
Cookie Settings
Cookies and similar technologies are used on this website for proper function of the website, for tracking performance analytics and for marketing purposes. We and some of our third-party providers may use cookie data for various purposes. Please review the cookie settings below and choose your preference.
Used for the proper function of the website
Used for monitoring website traffic and interactions
Cookie Settings
Cookies and similar technologies are used on this website for proper function of the website, for tracking performance analytics and for marketing purposes. We and some of our third-party providers may use cookie data for various purposes. Please review the cookie settings below and choose your preference.
Strictly Necessary: Used for the proper function of the website
Performance/Analytics: Used for monitoring website traffic and interactions
PowerBI is a powerful data visualization tool that helps them turn raw data into meaningful insights and actionable decisions. In this blog, we will explore the role of data analysts and how they use PowerBI to extract insights from data and drive business success. How does a data analyst use PowerBI?
Support for Various Data Warehouses and Databases : AnalyticsCreator supports MS SQL Server 2012-2022, Azure SQL Database, Azure Synapse Analytics dedicated, and more. Data Lakes : It supports MS Azure Blob Storage. Frontends : AnalyticsCreator supports PowerBI, Qlik Sense, Tableau, PowerPivot (Excel).
PowerBI Desktop is a wonderful business intelligence tool that has an expansive list of reporting capabilities, but there is one thing that you aren’t able to do with it – create a paginated report, which is a specific style of report that is designed to be exported or printed. What Is PowerBI Report Builder?
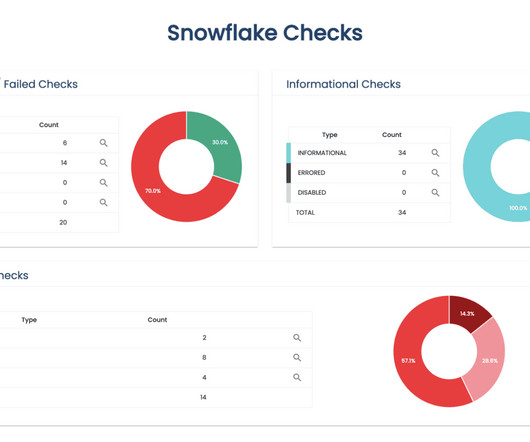
How to Optimize PowerBI and Snowflake for Advanced Analytics Spencer Baucke May 25, 2023 The world of business intelligence and data modernization has never been more competitive than it is today. Table of Contents Why Discuss Snowflake & PowerBI?
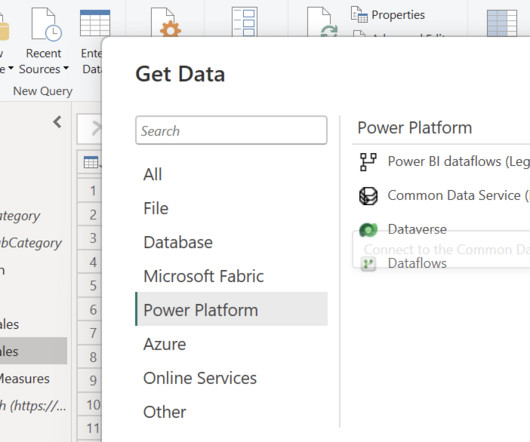
PowerBI Desktop enables the connection and retrieval of data from various sources, followed by data transformation using Power Query. To address this challenge, Microsoft introduced Dataflows within the PowerBI service. What are Dataflows in PowerBI?
They’ve tried to do this with the existing report created with PowerBI Desktop, and they can only see a small subset of the data from the table visualization when they export the report page as a PDF. In this blog post, we will introduce you to paginated reports in PowerBI and show you how to create one using PowerBI Report Builder.
Vielfältige Unterstützung: Kompatibel mit verschiedenen Datenbankmanagementsystemen wie MS SQL Server und Azure Synapse Analytics. Data Lakes: Unterstützt MS Azure Blob Storage. Frontends : Kompatibel mit Tools wie PowerBI, Qlik Sense und Tableau.
Summary : Microsoft Fabric is an end-to-end Data Analytics platform designed for integration, processing, and advanced insights, while PowerBI excels in creating interactive visualisations and reports. Key Takeaways Microsoft Fabric is a full-scale data platform, while PowerBI focuses on visualising insights.
As everyone knows, PowerBI is one of the best tools in the data analytics market for creating and sharing reports using the PowerBI service. We will also explain the backend process of establishing gateway connections and its advantages, which help in reporting effectively through PowerBI.
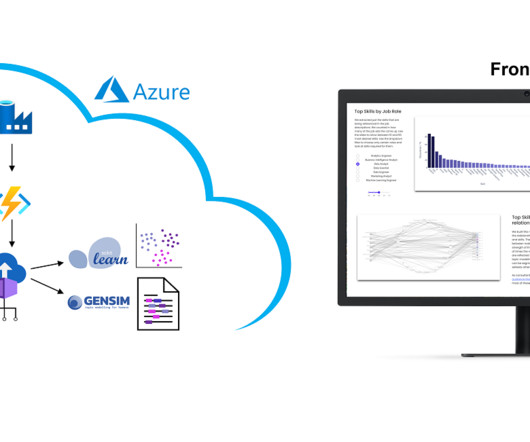
DATANOMIQ Jobskills Webapp The whole web app is hosted and deployed on the Microsoft Azure Cloud via CI/CD and Infrastructure as Code (IaC). However, we collect these over time and will make trends secure, for example how the demand for Python, SQL or specific tools such as dbt or PowerBI changes. Why we did it?
Introduction The world of software development is ever-evolving, and with the increasing demand for powerful and easy-to-use solutions, low-code development platforms have emerged as game-changers. Microsoft’s Power Platform Copilot is one such cutting-edge platform that aims to transform how we approach software development.
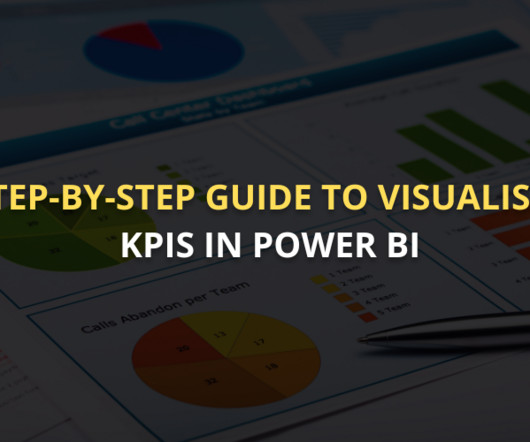
Summary: This guide covers visualising KPI in PowerBI, from setting up the tool and preparing data to selecting the right visuals and enhancing dashboards. PowerBI is an excellent tool for this purpose, offering powerful features to create interactive, dynamic visualisations that bring data to life.
PowerBI is a user-friendly and powerful data visualization tool that enables individuals to easily create interactive reports and dashboards as well as centralized datasets. In this blog, we will explain the difference between Full Refresh & Incremental Refresh and how to implement Incremental refresh in PowerBI.
PowerBI Datamarts is one of the most exciting features that Microsoft has released for the Power Platform in recent years. If you need high-level information on what a PowerBI Datamart is and some example use cases, check out our other blog, What Are PowerBI Datamarts?
Process Mining wurde kürzlich in die Power Automate Plattform und in PowerBI integriert. Process Mining Tools, die Business Intelligence Software erweitern Und dann gibt es noch diejenigen Anbieter, die bestehende BI Tools mit Erweiterungen zum Process Mining Analysewerkzeug machen. nicht mehr weiterentwickelt wird.
Summary: This blog provides a comprehensive roadmap for aspiring Azure Data Scientists, outlining the essential skills, certifications, and steps to build a successful career in Data Science using Microsoft Azure. This roadmap aims to guide aspiring Azure Data Scientists through the essential steps to build a successful career.
Advancements in data processing, storage, and analysis technologies power this transformation. This blog aims to highlight the synergy between Data Science and the cloud, showcase its indispensable role in modern analytics, and outline strategies for leveraging this powerful combination effectively.
It is therefore hardly surprising that some process mining tools are actually just a plugin for PowerBI, Tableau or Qlik. on Microsoft Azure, AWS, Google Cloud Platform or SAP Dataverse) significantly improve data utilization and drive effective business outcomes. Click to enlarge!
appeared first on Data Science Blog. Da mache ich es kurz: Unternehmen brauchen Datenstrategien und ein Big Picture , wie sie Daten richtig nutzen, dabei dann auch die unterschiedlichen Methoden der Nutzung dieser Daten richtig kombinieren. The post Interview – Business Intelligence und Process Mining ohne Vendor Lock-in!
SaaS apps may expose users to the following threats: Issues with compliance Lax rules for permitted use Unstable settings Potentially still-accessible inactive users SSPM security gives businesses the power they need to safeguard important corporate information that resides across many apps, as well as sometimes personal information.
This blog explores top certifications, factors to consider when choosing one, and future trends, helping aspiring and experienced analysts navigate their professional growth effectively. They use data visualisation tools like Tableau and PowerBI to create compelling reports.
In this blog, we will explore the arena of data science bootcamps and lay down a guide for you to choose the best data science bootcamp. Tools like Tableau, PowerBI, and Python libraries such as Matplotlib and Seaborn are commonly taught. These bootcamps are focused training and learning platforms for people.
In this blog, we’ll explore what bioinformatics is, how to become a Bioinformatics Scientist, the tools and techniques used, the various applications, the challenges, and the future directions of this exciting field. PowerBIPowerBI is a business analytics tool that allows researchers to create interactive dashboards and reports.
Alation is helping WoodmenLife find all its data and prioritize it for migration into what Rokon called “a new, intentional landscape” that includes Azure, Snowflake , and PowerBI. Subscribe to Alation's Blog Get the latest data cataloging news and trends in your inbox. That’s why I’m looking forward to what’s next.
This comprehensive blog outlines vital aspects of Data Analyst interviews, offering insights into technical, behavioural, and industry-specific questions. Yes, I am proficient in data visualisation tools such as Tableau, PowerBI, and Matplotlib in Python, which I use to create interactive and insightful visualisations for data analysis.
Read Blog Data Engineering Interview Questions and Answers Role of Data Engineers Data Engineers are the architects of data infrastructure. Cloud Platforms: AWS, Azure, Google Cloud, etc. Excel, Tableau, PowerBI, SQL Server, MySQL, Google Analytics, etc. ETL Tools: Apache NiFi, Talend, etc.
This blog was originally written by Erik Hyrkas and updated for 2024 by Justin Delisi This isn’t meant to be a technical how-to guide — most of those details are readily available via a quick Google search — but rather an opinionated review of key processes and potential approaches. authorization server.
In this blog post, we will introduce you to some of the best AI tools that you can try right now, sorted by category. These tools use machine learning, natural language processing, computer vision, and other AI techniques to provide you with powerful features and functionalities.
Data Mesh on Azure Cloud with Databricks and Delta Lake for Applications of Business Intelligence, Data Science and Process Mining. Microsoft Azure Cloud is favored by many companies, especially for European industrial companies, due to its scalability, flexibility, and industry-specific solutions.
Summary: This blog dives into the most promising PowerBI projects, exploring advanced data visualization, AI integration, IoT & blockchain analytics, and emerging technologies. Introduction to PowerBI Project s The world of Data Analysis is constantly evolving, and PowerBI stands at the forefront of this transformation.
Summary: PowerBI is a business intelligence tool that transforms raw data into actionable insights. PowerBI enhances decision-making by providing interactive dashboards and reports that are accessible to both technical and non-technical users. What Is PowerBI?
This blog explores the current state of Data Science, emerging trends, the role of generative AI, decision-making enhancements, ethical challenges, essential skills for future Data Scientists, and predictions for the next decade. Learn to use tools like Tableau, PowerBI, or Matplotlib to create compelling visual representations of data.
Summary This blog post demystifies data science for business leaders. Data Science Cheat Sheet for Business Leaders In today’s data-driven world, information is power. Tableau/PowerBI: Visualization tools for creating interactive and informative data visualizations. But raw data itself isn’t enough.
We all know how easy it is to refresh a single table in PowerBI Desktop by right-clicking the table and selecting Refresh Data. However, in PowerBI Service, we can only refresh the entire semantic model, as there is no out-of-the-box solution for refreshing a single table. By refreshing only the relevant table (e.g.,
In this blog, well explore the best data engineering tools that make data work easier, faster, and more reliable. PowerBIPowerBI is another widely used business intelligence tool that helps transform raw data into meaningful insights through interactive dashboards and reports.
We organize all of the trending information in your field so you don't have to. Join 17,000+ users and stay up to date on the latest articles your peers are reading.
You know about us, now we want to get to know you!
Let's personalize your content
Let's get even more personalized
We recognize your account from another site in our network, please click 'Send Email' below to continue with verifying your account and setting a password.


Let's personalize your content