This site uses cookies to improve your experience. To help us insure we adhere to various privacy regulations, please select your country/region of residence. If you do not select a country, we will assume you are from the United States. Select your Cookie Settings or view our Privacy Policy and Terms of Use.
Cookie Settings
Cookies and similar technologies are used on this website for proper function of the website, for tracking performance analytics and for marketing purposes. We and some of our third-party providers may use cookie data for various purposes. Please review the cookie settings below and choose your preference.
Used for the proper function of the website
Used for monitoring website traffic and interactions
Cookie Settings
Cookies and similar technologies are used on this website for proper function of the website, for tracking performance analytics and for marketing purposes. We and some of our third-party providers may use cookie data for various purposes. Please review the cookie settings below and choose your preference.
Strictly Necessary: Used for the proper function of the website
Performance/Analytics: Used for monitoring website traffic and interactions
To address this challenge, businesses need to use advanced dataanalysis methods. These methods can help businesses to make sense of their data and to identify trends and patterns that would otherwise be invisible. In recent years, there has been a growing interest in the use of artificial intelligence (AI) for dataanalysis.
Summary: Big Datavisualization involves representing large datasets graphically to reveal patterns, trends, and insights that are not easily discernible from raw data. quintillion bytes of data daily, the need for effective visualization techniques has never been greater. As we generate approximately 2.5
For instance, Berkeley’s Division of Data Science and Information points out that entry level data science jobs remote in healthcare involves skills in NLP (Natural Language Processing) for patient and genomic dataanalysis, whereas remote data science jobs in finance leans more on skills in risk modeling and quantitative analysis.
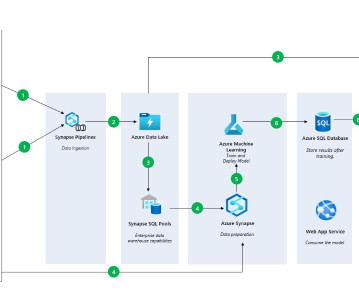
Companies use Business Intelligence (BI), Data Science , and Process Mining to leverage data for better decision-making, improve operational efficiency, and gain a competitive edge. One of this aspect is the cloud architecture for the realization of Data Mesh. See this as an example which has many possible alternatives.
Data is an essential component of any business, and it is the role of a data analyst to make sense of it all. Power BI is a powerful datavisualization tool that helps them turn raw data into meaningful insights and actionable decisions. Check out this course and learn Power BI today!
With this full-fledged solution, you don’t have to spend all your time and effort combining different services or duplicating data. OneLake, being built on AzureData Lake Storage (ADLS), supports various data formats, including Delta, Parquet, CSV, and JSON.
Summary: This blog provides a comprehensive roadmap for aspiring AzureData Scientists, outlining the essential skills, certifications, and steps to build a successful career in Data Science using Microsoft Azure. What is Azure?
All you need in one place So is the Microsoft Fabric price the tech giant’s only plan to stay ahead of the data game? Flexible datavisualization : Power BI’s customizable and visually appealing charts and reports, combined with Fabric’s efficient data storage, provide a flexible and engaging datavisualization experience.
Experts from the field gathered to discuss and deliberate on various topics related to data and AI, sharing their insights with the attendees. Tutorials Day 2 of the Future of Data and AI conference focused on providing tutorials on several trending technology topics, along with our distinguished speakers sharing their valuable insights.
Analytics and DataAnalysis Coming in as the 4th most sought-after skill is data analytics, as many data scientists will be expected to do some analysis in their careers. Cloud Services The only two to make multiple lists were Amazon Web Services (AWS) and Microsoft Azure.
Data science bootcamps are intensive short-term educational programs designed to equip individuals with the skills needed to enter or advance in the field of data science. They cover a wide range of topics, ranging from Python, R, and statistics to machine learning and datavisualization.
Using Azure ML to Train a Serengeti Data Model, Fast Option Pricing with DL, and How To Connect a GPU to a Container Using Azure ML to Train a Serengeti Data Model for Animal Identification In this article, we will cover how you can train a model using Notebooks in Azure Machine Learning Studio.
This includes duplicate removal, missing value treatment, variable transformation, and normalization of data. Tools like Python (with pandas and NumPy), R, and ETL platforms like Apache NiFi or Talend are used for data preparation before analysis.
Navigate through 6 Popular Python Libraries for Data Science R R is another important language, particularly valued in statistics and dataanalysis, making it useful for AI applications that require intensive data processing.
You can import data from multiple data sources, such as Amazon Simple Storage Service (Amazon S3), Amazon Athena , Amazon Redshift , Amazon EMR , and Snowflake. With this new feature, you can use your own identity provider (IdP) such as Okta , Azure AD , or Ping Federate to connect to Snowflake via Data Wrangler.
You can perform dataanalysis within SQL Though mentioned in the first example, let’s expand on this a bit more. SQL allows for some pretty hefty and easy ad-hoc dataanalysis for the data professional on the go. Imagine combining the data power of SQL with your preferred scripting program.
Summary: This blog dives into the most promising Power BI projects, exploring advanced datavisualization, AI integration, IoT & blockchain analytics, and emerging technologies. Discover best practices for successful implementation and propel your organization towards data-driven success.
Basic knowledge of statistics is essential for data science. Statistics is broadly categorized into two types – Descriptive statistics – Descriptive statistics is describing the data. Visual graphs are the core of descriptive statistics. Exploratory DataAnalysis. Use cases of data science.
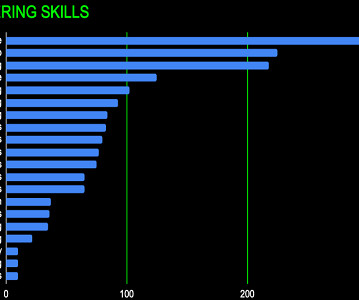
We looked at over 25,000 job descriptions, and these are the data analytics platforms, tools, and skills that employers are looking for in 2023. Excel is the second most sought-after tool in our chart as you’ll see below as it’s still an industry standard for data management and analytics.
Here is one of the Excel Python integration images shared by Microsoft ( Image Credit ) Stefan Kinnestrand, the luminary General Manager for Modern Work at Microsoft, reveals the essence of this integration, stating, “Now you can do advanced dataanalysis in the familiar Excel environment by accessing Python directly from the Excel ribbon.”
If you are unsure whether a specific dataset meets the competition data requirement, just ask in the competition forum. For example, the Google Earth API can be used to access Landsat , MODIS , VIIRS , GEDI , and SMAP data. You can use VEDA to discover Earth observation datasets, as well as to easily visualizedata online.
It integrates seamlessly with a wide range of data sources like Excel, Azure and SQL server, Salesforce, SAP Hana, IBM Netezza and CDP which makes it a compelling choice for businesses that have already invested in the Microsoft ecosystem. It allows users to create highly customizable and visually appealing reports.
Copilot is deeply integrated into Microsoft’s productivity tools, like Word , Excel , and PowerPoint , making it ideal for tasks involving documents, dataanalysis, and project management. It’s designed to assist with specific workflows and leverage enterprise data, making it a strong tool for businesses.
Proficient in programming languages like Python or R, data manipulation libraries like Pandas, and machine learning frameworks like TensorFlow and Scikit-learn, data scientists uncover patterns and trends through statistical analysis and datavisualization. DataVisualization: Matplotlib, Seaborn, Tableau, etc.
Blind 75 LeetCode Questions - LeetCode Discuss Data Manipulation and Analysis Proficiency in working with data is crucial. This includes skills in data cleaning, preprocessing, transformation, and exploratory dataanalysis (EDA).
They employ statistical methods and machine learning techniques to interpret data. Key Skills Expertise in statistical analysis and datavisualization tools. Key Skills Experience with cloud platforms (AWS, Azure). Data Analyst Data Analysts gather and interpret data to help organisations make informed decisions.
Augmented Analytics Augmented analytics is revolutionising the way businesses analyse data by integrating Artificial Intelligence (AI) and Machine Learning (ML) into analytics processes. Understand data structures and explore data warehousing concepts to efficiently manage and retrieve large datasets.
Using sophisticated datavisualization tools, many of which are powered by AI, app analytics services empower businesses to better understand IT operations , helping teams make smarter decisions, faster. AI in SaaS analytics Most industries have had to reckon with AI proliferation and AI-driven business practices to some extent.
This comprehensive blog outlines vital aspects of Data Analyst interviews, offering insights into technical, behavioural, and industry-specific questions. It covers essential topics such as SQL queries, datavisualization, statistical analysis, machine learning concepts, and data manipulation techniques.
The University of Nottingham offers a Master of Science in Bioinformatics, which is aimed at students with a background in biological sciences who wish to develop skills in bioinformatics, statistics, computer programming , and Data Analytics. Familiarise yourself with dataanalysis tools such as RStudio, Jupyter Notebook, and Excel.
Datavisualization is a critical way for anyone to turn endless rows of data into easy-to-understand results through dynamic and understandable visuals. And with augmented analytics (and embedded insights), anyone can become a citizen data scientist, regardless of their advanced analytics expertise.
Tools and Technologies Python/R: Popular programming languages for dataanalysis and machine learning. Tableau/Power BI: Visualization tools for creating interactive and informative datavisualizations. Hadoop/Spark: Frameworks for distributed storage and processing of big data.
Data Backup and Recovery : Have a data storage platform that supports a contingency plan for unexpected data loss and deletion, which can be quite common in a long-duration project. Data Compression : Explore data compression techniques to optimize storage space, primarily as long-term ML projects collect more data.
Data science methodologies and skills can be leveraged to design these experiments, analyze results, and iteratively improve prompt strategies. Using skills such as statistical analysis and datavisualization techniques, prompt engineers can assess the effectiveness of different prompts and understand patterns in the responses.
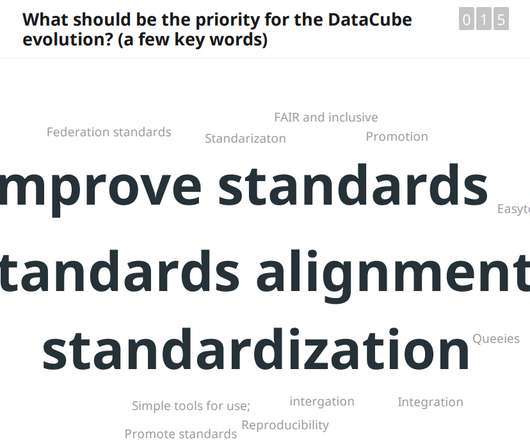
Presenters and participants had the opportunity to hear about and evaluate the pros and cons of different back end technologies and data formats for different uses such as web-mapping, datavisualization, and the sharing of meta-data. These can be cleaned to remove artifacts and/or outdated elements.
Sales teams can forecast trends, optimize lead scoring, and enhance customer engagement all while reducing manual dataanalysis. From customer service chatbots to data-driven decision-making , Watson enables businesses to extract insights from large-scale datasets with precision.
It eliminates the need for complex database management, making dataanalysis more accessible. Apache Airflow Apache Airflow is a workflow automation tool that allows data engineers to schedule, monitor, and manage data pipelines efficiently. It helps streamline data processing tasks and ensures reliable execution.
We organize all of the trending information in your field so you don't have to. Join 17,000+ users and stay up to date on the latest articles your peers are reading.
You know about us, now we want to get to know you!
Let's personalize your content
Let's get even more personalized
We recognize your account from another site in our network, please click 'Send Email' below to continue with verifying your account and setting a password.


Let's personalize your content