This site uses cookies to improve your experience. To help us insure we adhere to various privacy regulations, please select your country/region of residence. If you do not select a country, we will assume you are from the United States. Select your Cookie Settings or view our Privacy Policy and Terms of Use.
Cookie Settings
Cookies and similar technologies are used on this website for proper function of the website, for tracking performance analytics and for marketing purposes. We and some of our third-party providers may use cookie data for various purposes. Please review the cookie settings below and choose your preference.
Used for the proper function of the website
Used for monitoring website traffic and interactions
Cookie Settings
Cookies and similar technologies are used on this website for proper function of the website, for tracking performance analytics and for marketing purposes. We and some of our third-party providers may use cookie data for various purposes. Please review the cookie settings below and choose your preference.
Strictly Necessary: Used for the proper function of the website
Performance/Analytics: Used for monitoring website traffic and interactions
Remote work quickly transitioned from a perk to a necessity, and datascience—already digital at heart—was poised for this change. For data scientists, this shift has opened up a global market of remote datascience jobs, with top employers now prioritizing skills that allow remote professionals to thrive.
Data is an essential component of any business, and it is the role of a data analyst to make sense of it all. PowerBI is a powerfuldata visualization tool that helps them turn raw data into meaningful insights and actionable decisions. How does a data analyst use PowerBI?
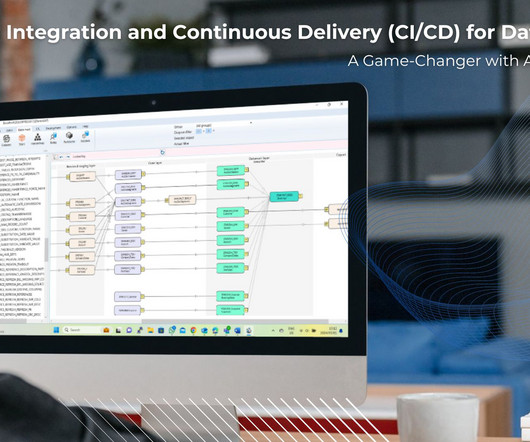
Continuous Integration and Continuous Delivery (CI/CD) for Data Pipelines: It is a Game-Changer with AnalyticsCreator! The need for efficient and reliable data pipelines is paramount in datascience and data engineering. Data Lakes : It supports MS Azure Blob Storage. pipelines, AzureData Bricks.
Welcome to Cloud DataScience 8. This weeks news includes information about AWS working with Azure, time-series, detecting text in videos and more. Amazon Redshift now supports Authentication with Microsoft Azure AD Redshift, a data warehouse, from Amazon now integrates with Azure Active Directory for login.
With this full-fledged solution, you don’t have to spend all your time and effort combining different services or duplicating data. OneLake, being built on AzureData Lake Storage (ADLS), supports various data formats, including Delta, Parquet, CSV, and JSON. Choose a visual of interest.
Summary: “DataScience in a Cloud World” highlights how cloud computing transforms DataScience by providing scalable, cost-effective solutions for big data, Machine Learning, and real-time analytics. Advancements in data processing, storage, and analysis technologies power this transformation.
You can get this information as the Microsoft AzureData Scientist Checklist. Below is the basic structure of the DP-100: Designing and Implementing a DataScience Solution on Azure. Passing the exam will qualify you for the AzureData Scientist Associate certification. Azure ML Studio.
Datascience bootcamps are intensive short-term educational programs designed to equip individuals with the skills needed to enter or advance in the field of datascience. They cover a wide range of topics, ranging from Python, R, and statistics to machine learning and data visualization.
Summary: Business Analytics focuses on interpreting historical data for strategic decisions, while DataScience emphasizes predictive modeling and AI. Introduction In today’s data-driven world, businesses increasingly rely on analytics and insights to drive decisions and gain a competitive edge.
Data Drift Monitoring for Azure ML Datasets Azure ML now provides monitoring for when your data changes (called data drift). It focuses on using AWS products to solve datascience problems. Courses & Learning. It is February 19, 2020.
Microsoft Fabric combines multiple elements into a single platform – Image courtesy of Microsoft The contribution of PowerBI The integration of Microsoft PowerBI and Microsoft Fabric offers a powerful combination for organizations seeking comprehensive data analytics and insights.
Die Bedeutung effizienter und zuverlässiger Datenpipelines in den Bereichen DataScience und Data Engineering ist enorm. Vielfältige Unterstützung: Kompatibel mit verschiedenen Datenbankmanagementsystemen wie MS SQL Server und Azure Synapse Analytics. Data Lakes: Unterstützt MS Azure Blob Storage.
In March 2023, we had the pleasure of hosting the first edition of the Future of Data and AI conference – an incredible tech extravaganza that drew over 10,000 attendees, featured 30+ industry experts as speakers, and offered 20 engaging panels and tutorials led by the talented team at DataScience Dojo.
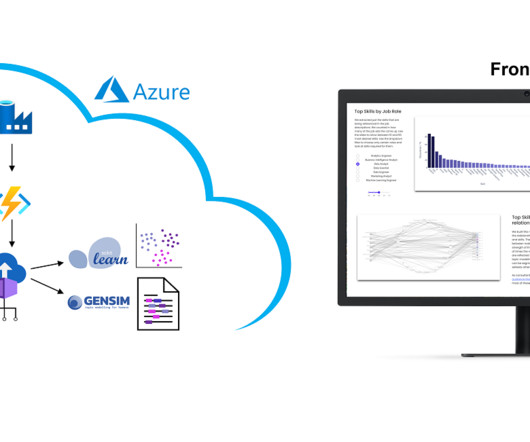
DATANOMIQ Jobskills Webapp The whole web app is hosted and deployed on the Microsoft Azure Cloud via CI/CD and Infrastructure as Code (IaC). However, we collect these over time and will make trends secure, for example how the demand for Python, SQL or specific tools such as dbt or PowerBI changes. Why we did it?
The Datamarts capability opens endless possibilities for organizations to achieve their data analytics goals on the PowerBI platform. Before we look into the PowerBI Datamarts, let us take a step back and understand the meaning of a Datamart. What is PowerBI Datamarts?
Für DataScience ja sowieso. Vor einen Jahrzehnt war es immer noch recht üblich, sich einfach ein BI Tool zu nehmen, sowas wie QlikView, Tableau oder PowerBI, mittlerweile gibt es ja noch einige mehr, und da direkt die Daten reinzuladen und dann halt loszulegen mit dem Aufbau der Reports. appeared first on DataScience Blog.
In addition to Business Intelligence (BI), Process Mining is no longer a new phenomenon, but almost all larger companies are conducting this data-driven process analysis in their organization. For analysis the way of Business Intelligence this normalized data model can already be used. Click to enlarge!
Summary : Microsoft Fabric is an end-to-end Data Analytics platform designed for integration, processing, and advanced insights, while PowerBI excels in creating interactive visualisations and reports. Both tools complement each other, enabling seamless data management and visualisation. What is PowerBI?
Dabei arbeiten wir technologie-offen und mit nahezu allen Tools – Und oft in enger Verbindung mit Initiativen der Business Intelligence und DataScience. Process Mining wurde kürzlich in die Power Automate Plattform und in PowerBI integriert. – Fluxicon (Disco) ist vom Chart verschwunden.
Summary: This blog provides a comprehensive roadmap for aspiring AzureData Scientists, outlining the essential skills, certifications, and steps to build a successful career in DataScience using Microsoft Azure. What is Azure?
The roles of data scientists and data analysts cannot be over-emphasized as they are needed to support decision-making. This article will serve as an ultimate guide to choosing between DataScience and Data Analytics. Before going into the main purpose of this article, what is data?
Before embarking on a datascience transition, it’s crucial to be aware of these key factors. Before diving into the world of datascience, it is essential to familiarize yourself with certain key aspects. Moreover, tools like PowerBI and Tableau can produce remarkable results.
Looking to take your data analytics and visualization to the next level? Check out this course and learn PowerBI today! The usefulness of CSPM’s risk assessment and mitigation for enterprises with just cloud-based data storage is undeniable. Some solutions additionally protect unique applications.
Together, data engineers, data scientists, and machine learning engineers form a cohesive team that drives innovation and success in data analytics and artificial intelligence. Their collective efforts are indispensable for organizations seeking to harness data’s full potential and achieve business growth.
For budding data scientists and data analysts, there are mountains of information about why you should learn R over Python and the other way around. Though both are great to learn, what gets left out of the conversation is a simple yet powerful programming language that everyone in the datascience world can agree on, SQL.
Software like Microsoft Excel and SQL helps them manipulate and query data efficiently. They use data visualisation tools like Tableau and PowerBI to create compelling reports. Additionally, familiarity with Machine Learning frameworks and cloud-based platforms like AWS or Azure adds value to their expertise.
As the sibling of datascience, data analytics is still a hot field that garners significant interest. Companies have plenty of data at their disposal and are looking for people who can make sense of it and make deductions quickly and efficiently. Cloud Services: Google Cloud Platform, AWS, Azure.
EVENT — ODSC East 2024 In-Person and Virtual Conference April 23rd to 25th, 2024 Join us for a deep dive into the latest datascience and AI trends, tools, and techniques, from LLMs to data analytics and from machine learning to responsible AI. Prefect’s design is particularly suited for modern cloud-based data environments.
This functionality speeds up data processing and improves accuracy by reducing human errors. PowerBI Integration It brings real-time analytics and advanced reporting capabilities to Excel. PowerBI’s AI features complement Excel’s functionalities by enabling more sophisticated data visualisations and interactive dashboards.
Summary: Descriptive Analytics tools transform historical data into visual reports, helping businesses identify trends and improve decision-making. Popular tools like PowerBI, Tableau, and Google Data Studio offer unique features for Data Analysis.
The datascience job market is rapidly evolving, reflecting shifts in technology and business needs. Heres what we noticed from analyzing this data, highlighting whats remained the same over the years, and what additions help make the modern data scientist in2025. Joking aside, this does infer particular skills.
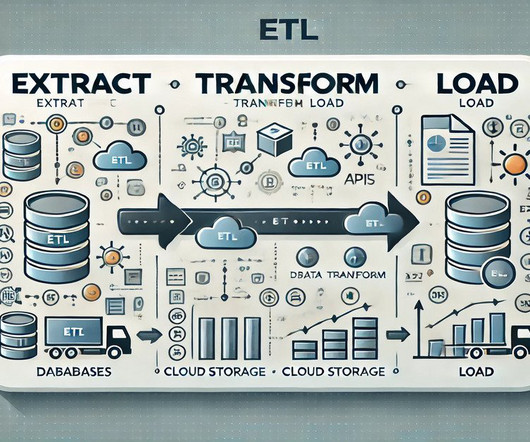
It supports both batch and real-time data processing , making it highly versatile. Its ability to integrate with cloud platforms like AWS and Azure makes it an excellent choice for businesses moving to the cloud. Talend’s user-friendly interface allows even non-technical users to design workflows efficiently.
Some of the key tools used for data visualisation include: Tableau Tableau is a data visualisation tool that allows researchers to create interactive dashboards and reports. It is useful for visualising complex data and identifying patterns and trends. It is useful for storing and processing large datasets.
Key storage solutions include: Data Lakes: Centralised repositories that store raw data in its native format until needed for analysis. Data Lakes allows for flexibility in handling different data types.
Yes, I am proficient in data visualisation tools such as Tableau, PowerBI, and Matplotlib in Python, which I use to create interactive and insightful visualisations for data analysis. Have you worked with cloud-based data platforms like AWS, Google Cloud, or Azure? 10% group discount available.
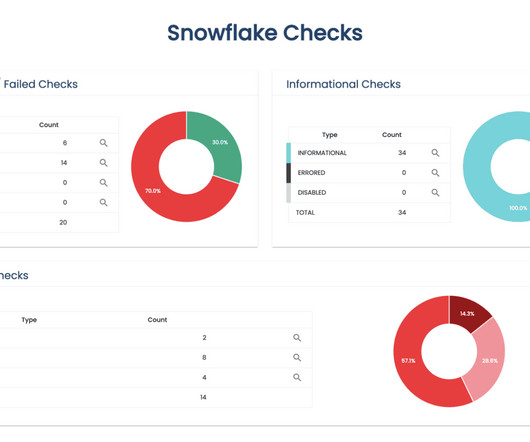
The software you might use OAuth with includes: Tableau PowerBI Sigma Computing If so, you will need an OAuth provider like Okta, Microsoft Azure AD, Ping Identity PingFederate, or a Custom OAuth 2.0 When to use SCIM vs phData's Provision Tool SCIM manages users and groups with Azure Active Directory or Okta.
Companies use Business Intelligence (BI), DataScience , and Process Mining to leverage data for better decision-making, improve operational efficiency, and gain a competitive edge. The integration of these technologies helps companies harness data for growth and efficiency.
Summary: The future of DataScience is shaped by emerging trends such as advanced AI and Machine Learning, augmented analytics, and automated processes. As industries increasingly rely on data-driven insights, ethical considerations regarding data privacy and bias mitigation will become paramount.
Summary This blog post demystifies datascience for business leaders. It explains key concepts, explores applications for business growth, and outlines steps to prepare your organization for data-driven success. DataScience Cheat Sheet for Business Leaders In today’s data-driven world, information is power.
There is a plethora of BI tools available in the market today, with new ones being added yearly. Through a comparative analysis of some of the leading BI tools: Google Looker, Microsoft PowerBI, Tableau and Qlik Sense, discover which BI solution best fits your organization’s data analytics needs to empower informed decision-making.
Learning these tools is crucial for building scalable data pipelines. offers DataScience courses covering these tools with a job guarantee for career growth. Introduction Imagine a world where data is a messy jungle, and we need smart tools to turn it into useful insights.
We organize all of the trending information in your field so you don't have to. Join 17,000+ users and stay up to date on the latest articles your peers are reading.
You know about us, now we want to get to know you!
Let's personalize your content
Let's get even more personalized
We recognize your account from another site in our network, please click 'Send Email' below to continue with verifying your account and setting a password.


Let's personalize your content