This site uses cookies to improve your experience. To help us insure we adhere to various privacy regulations, please select your country/region of residence. If you do not select a country, we will assume you are from the United States. Select your Cookie Settings or view our Privacy Policy and Terms of Use.
Cookie Settings
Cookies and similar technologies are used on this website for proper function of the website, for tracking performance analytics and for marketing purposes. We and some of our third-party providers may use cookie data for various purposes. Please review the cookie settings below and choose your preference.
Used for the proper function of the website
Used for monitoring website traffic and interactions
Cookie Settings
Cookies and similar technologies are used on this website for proper function of the website, for tracking performance analytics and for marketing purposes. We and some of our third-party providers may use cookie data for various purposes. Please review the cookie settings below and choose your preference.
Strictly Necessary: Used for the proper function of the website
Performance/Analytics: Used for monitoring website traffic and interactions
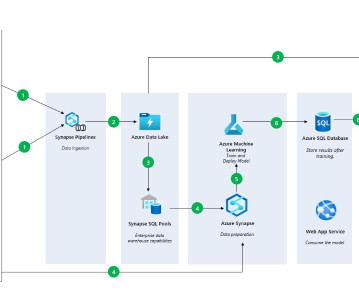
This article was published as a part of the Data Science Blogathon. Introduction Azure Synapse Analytics is a cloud-based service that combines the capabilities of enterprise data warehousing, big data, data integration, datavisualization and dashboarding.
This article was published as a part of the Data Science Blogathon Overview Tableau is a well-known datavisualization tool widely used in the industry and adopted by major firms like Nike, Coca-Cola, Skype, TCS, Accenture, and various other plethoras of companies both large and small.
ArticleVideo Book This article was published as a part of the Data Science Blogathon. The post Learn how to get insights from Azure SQL Database: A sample data analytics project using Global Peace Index data appeared first on Analytics Vidhya. Introduction Are you passionate about the empirical investigation to find.
Summary: Big Datavisualization involves representing large datasets graphically to reveal patterns, trends, and insights that are not easily discernible from raw data. quintillion bytes of data daily, the need for effective visualization techniques has never been greater. As we generate approximately 2.5
It could be a curated dataset, a machine learning model, an API that exposes data, a real-time data stream, a datavisualization dashboard, or any other data-related asset that provides value to the organization. One of this aspect is the cloud architecture for the realization of Data Mesh.
Their role is crucial in understanding the underlying data structures and how to leverage them for insights. Key Skills Proficiency in SQL is essential, along with experience in datavisualization tools such as Tableau or Power BI.
Data is an essential component of any business, and it is the role of a data analyst to make sense of it all. Power BI is a powerful datavisualization tool that helps them turn raw data into meaningful insights and actionable decisions. Learn Power BI with this crash course in no time!
Data Science Dojo is offering Meltano CLI for FREE on Azure Marketplace preconfigured with Meltano, a platform that provides flexibility and scalability. Meltano CLI stands out as a data engineering tool. What Data Science Dojo has for you? It is somewhat of a tiring process to install the technology. It is customizable.
Microsoft Azure Machine Learning Microsoft Azure Machine Learning is a cloud-based platform that can be used for a variety of data analysis tasks. It is a powerful tool that can be used to automate many of the tasks involved in data analysis, and it can also help businesses to discover new insights from their data.
The curriculum includes topics such as data mining, machine learning, and datavisualization. Data Science Dojo provides both online and in-person data science bootcamps in Redmond, Washington.
Summary: This blog provides a comprehensive roadmap for aspiring AzureData Scientists, outlining the essential skills, certifications, and steps to build a successful career in Data Science using Microsoft Azure. What is Azure?
All you need in one place So is the Microsoft Fabric price the tech giant’s only plan to stay ahead of the data game? Flexible datavisualization : Power BI’s customizable and visually appealing charts and reports, combined with Fabric’s efficient data storage, provide a flexible and engaging datavisualization experience.
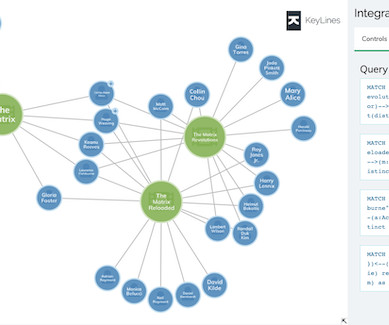
This Azure Cosmos DB tutorial shows you how to integrate Microsoft’s multi-model database service with our graph and timeline visualization SDKs to build an interactive graph application. There’s support for MongoDB, PostgreSQL, Apache Cassandra, Apache Gremlin, and Tables, and our datavisualization toolkits work with all of them.
Experts from the field gathered to discuss and deliberate on various topics related to data and AI, sharing their insights with the attendees. Tutorials Day 2 of the Future of Data and AI conference focused on providing tutorials on several trending technology topics, along with our distinguished speakers sharing their valuable insights.
With this full-fledged solution, you don’t have to spend all your time and effort combining different services or duplicating data. OneLake, being built on AzureData Lake Storage (ADLS), supports various data formats, including Delta, Parquet, CSV, and JSON.
IBM’s recommendations included API-specific improvements, bot UX optimization, workflow optimization, DevOps microservices and design consideration, and best practices for Azure manage services.
Using Azure ML to Train a Serengeti Data Model, Fast Option Pricing with DL, and How To Connect a GPU to a Container Using Azure ML to Train a Serengeti Data Model for Animal Identification In this article, we will cover how you can train a model using Notebooks in Azure Machine Learning Studio.
Data science bootcamps are intensive short-term educational programs designed to equip individuals with the skills needed to enter or advance in the field of data science. They cover a wide range of topics, ranging from Python, R, and statistics to machine learning and datavisualization.
Here are some of the key types of cloud analytics: Descriptive analytics: This type focuses on summarizing historical data to provide insights into what has happened in the past. It helps organizations understand trends, patterns, and anomalies in their data.
Two of the platforms that we see emerging as a popular combination of data warehousing and business intelligence are the Snowflake Data Cloud and Power BI. Debuting in 2015, Power BI has undergone meaningful updates that have made it a leader not just in datavisualization, but in the business intelligence space as well.
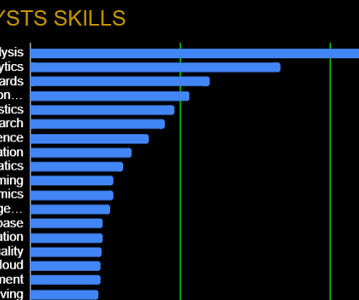
Analytics and Data Analysis Coming in as the 4th most sought-after skill is data analytics, as many data scientists will be expected to do some analysis in their careers. This doesn’t mean anything too complicated, but could range from basic Excel work to more advanced reporting to be used for datavisualization later on.
Either way, you may have noticed two things: Tableau Blueprint is designed to help you and your organization, no matter how small or large, be successful with data, visualization, analysis, governance, and more. It’s all completely free!
Navigate through 6 Popular Python Libraries for Data Science R R is another important language, particularly valued in statistics and data analysis, making it useful for AI applications that require intensive data processing.
Introduction The world of software development is ever-evolving, and with the increasing demand for powerful and easy-to-use solutions, low-code development platforms have emerged as game-changers. Microsoft’s Power Platform Copilot is one such cutting-edge platform that aims to transform how we approach software development.
You can import data from multiple data sources, such as Amazon Simple Storage Service (Amazon S3), Amazon Athena , Amazon Redshift , Amazon EMR , and Snowflake. With this new feature, you can use your own identity provider (IdP) such as Okta , Azure AD , or Ping Federate to connect to Snowflake via Data Wrangler.
Link to event -> Generative AI and Data Storytelling Here are some of the key takeaways from the article: Generative AI is a type of artificial intelligence that can create new content, such as text, images, and music. Data storytelling is the process of using data to communicate a story in a way that is engaging and informative.
Microsoft’s Azure OpenAI Service Integrates ChatGPT for Advanced NLP and Responsible AI Microsoft has announced through a blog post that ChatGPT is now available in the Azure OpenAI Service. Topics include data Ingestion from object storage, dataset preparation (infer labels, splitting, augmenting, optimizing), and more.
Support for Power BI on Azure and catalogs: workflow, apps, reports, dashboards, tiles, datasets, dataset fields. This means the new connector will deliver better performance, increased security, and a consistent user experience. Highlights of the new connector include: Compatibility with Alation version 2021.3
Summary: This blog dives into the most promising Power BI projects, exploring advanced datavisualization, AI integration, IoT & blockchain analytics, and emerging technologies. Discover best practices for successful implementation and propel your organization towards data-driven success.
As you’ll see below, however, a growing number of data analytics platforms, skills, and frameworks have altered the traditional view of what a data analyst is. Data Presentation: Communication Skills, DataVisualization Any good data analyst can go beyond just number crunching.
It integrates seamlessly with a wide range of data sources like Excel, Azure and SQL server, Salesforce, SAP Hana, IBM Netezza and CDP which makes it a compelling choice for businesses that have already invested in the Microsoft ecosystem. It allows users to create highly customizable and visually appealing reports.
A good course to upskill in this area is — Machine Learning Specialization DataVisualization The ability to effectively communicate insights through datavisualization is important. Check out this course to upskill on Apache Spark — [link] Cloud Computing technologies such as AWS, GCP, Azure will also be a plus.
They need to translate data insights into actionable business strategies, making stakeholder engagement and storytelling through datavisualization critical skills. Data Scientists rely on technical proficiency. They must also stay updated on tools such as TensorFlow, Hadoop, and cloud-based platforms like AWS or Azure.
If you are unsure whether a specific dataset meets the competition data requirement, just ask in the competition forum. HRRR has been used for applications like predicting the path of wildfire smoke and optimizing wind energy use.
Microsoft Copilot is built into Bing, Windows 10, Windows 11, and the Edge sidebar, but it has also expanded to mobile devices with standalone apps for Android and iOS ( Image credit ) Copilot for Azure Suggests configurations for apps and environments hosted on Microsoft Azure. This helps ensure nothing falls through the cracks.
They employ statistical methods and machine learning techniques to interpret data. Key Skills Expertise in statistical analysis and datavisualization tools. Key Skills Experience with cloud platforms (AWS, Azure). Data Analyst Data Analysts gather and interpret data to help organisations make informed decisions.
The driving force behind this innovation involves a strategic alliance between Microsoft and the data science powerhouse, Anaconda. This symbiotic collaboration taps into the Azure-powered Anaconda Python distribution, bringing a bevy of Python’s most celebrated libraries to the Excel landscape.
Cloud-Based Orchestration Tools While open-source tools are powerful, cloud-based orchestration services like AWS Glue, AzureData Factory, and Google Cloud Dataflow offer managed solutions that reduce the burden of infrastructure management.
Basic knowledge of statistics is essential for data science. Statistics is broadly categorized into two types – Descriptive statistics – Descriptive statistics is describing the data. Visual graphs are the core of descriptive statistics. Use cases of data science. Learn when to use which technique.
That’s why our datavisualization SDKs are database agnostic: so you’re free to choose the right stack for your application. Visualizingdata with ArangoDB Azure Cosmos DB “A graph database service that can be used to store massive graphs with billions of vertices and edges.
Using sophisticated datavisualization tools, many of which are powered by AI, app analytics services empower businesses to better understand IT operations , helping teams make smarter decisions, faster. AI in SaaS analytics Most industries have had to reckon with AI proliferation and AI-driven business practices to some extent.
Proficient in programming languages like Python or R, data manipulation libraries like Pandas, and machine learning frameworks like TensorFlow and Scikit-learn, data scientists uncover patterns and trends through statistical analysis and datavisualization. DataVisualization: Matplotlib, Seaborn, Tableau, etc.
It opens a lot of possibilities when it comes to statistical modeling, visualization, and overall analysis. Many cloud providers, such as Amazon Web Services and Microsoft Azure, offer SQL-based database services that can be used to store and analyze data in the cloud. Finally, cloud services.
We organize all of the trending information in your field so you don't have to. Join 17,000+ users and stay up to date on the latest articles your peers are reading.
You know about us, now we want to get to know you!
Let's personalize your content
Let's get even more personalized
We recognize your account from another site in our network, please click 'Send Email' below to continue with verifying your account and setting a password.


Let's personalize your content