This site uses cookies to improve your experience. To help us insure we adhere to various privacy regulations, please select your country/region of residence. If you do not select a country, we will assume you are from the United States. Select your Cookie Settings or view our Privacy Policy and Terms of Use.
Cookie Settings
Cookies and similar technologies are used on this website for proper function of the website, for tracking performance analytics and for marketing purposes. We and some of our third-party providers may use cookie data for various purposes. Please review the cookie settings below and choose your preference.
Used for the proper function of the website
Used for monitoring website traffic and interactions
Cookie Settings
Cookies and similar technologies are used on this website for proper function of the website, for tracking performance analytics and for marketing purposes. We and some of our third-party providers may use cookie data for various purposes. Please review the cookie settings below and choose your preference.
Strictly Necessary: Used for the proper function of the website
Performance/Analytics: Used for monitoring website traffic and interactions
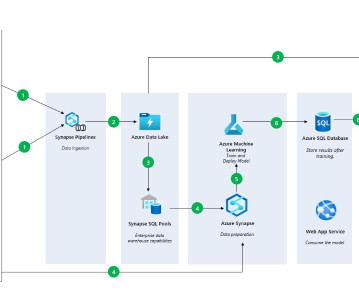
This article was published as a part of the Data Science Blogathon. Introduction Azure Synapse Analytics is a cloud-based service that combines the capabilities of enterprise data warehousing, big data, data integration, datavisualization and dashboarding.
ArticleVideo Book This article was published as a part of the Data Science Blogathon. The post Learn how to get insights from AzureSQL Database: A sample data analytics project using Global Peace Index data appeared first on Analytics Vidhya.
They work closely with database administrators to ensure data integrity, develop reporting tools, and conduct thorough analyses to inform business strategies. Their role is crucial in understanding the underlying data structures and how to leverage them for insights.
Data is an essential component of any business, and it is the role of a data analyst to make sense of it all. Power BI is a powerful datavisualization tool that helps them turn raw data into meaningful insights and actionable decisions. Learn Power BI with this crash course in no time!
Data Storytelling in Action: This panel will discuss the importance of datavisualization in storytelling in different industries, different visualization tools, tips on improving one’s visualization skills, personal experiences, breakthroughs, pressures, and frustrations as well as successes and failures.
Though both are great to learn, what gets left out of the conversation is a simple yet powerful programming language that everyone in the data science world can agree on, SQL. But why is SQL, or Structured Query Language , so important to learn? Let’s start with the first clause often learned by new SQL users, the WHERE clause.
With this full-fledged solution, you don’t have to spend all your time and effort combining different services or duplicating data. OneLake, being built on AzureData Lake Storage (ADLS), supports various data formats, including Delta, Parquet, CSV, and JSON.
All you need in one place So is the Microsoft Fabric price the tech giant’s only plan to stay ahead of the data game? Unified data storage : Fabric’s centralized data lake, Microsoft OneLake, eliminates data silos and provides a unified storage system, simplifying data access and retrieval.
Data can be generated from databases, sensors, social media platforms, APIs, logs, and web scraping. Data can be in structured (like tables in databases), semi-structured (like XML or JSON), or unstructured (like text, audio, and images) form.
Summary: This blog provides a comprehensive roadmap for aspiring AzureData Scientists, outlining the essential skills, certifications, and steps to build a successful career in Data Science using Microsoft Azure. What is Azure?
Data science bootcamps are intensive short-term educational programs designed to equip individuals with the skills needed to enter or advance in the field of data science. They cover a wide range of topics, ranging from Python, R, and statistics to machine learning and datavisualization.
IBM’s recommendations included API-specific improvements, bot UX optimization, workflow optimization, DevOps microservices and design consideration, and best practices for Azure manage services.
This doesn’t mean anything too complicated, but could range from basic Excel work to more advanced reporting to be used for datavisualization later on. Computer Science and Computer Engineering Similar to knowing statistics and math, a data scientist should know the fundamentals of computer science as well.
Using Azure ML to Train a Serengeti Data Model, Fast Option Pricing with DL, and How To Connect a GPU to a Container Using Azure ML to Train a Serengeti Data Model for Animal Identification In this article, we will cover how you can train a model using Notebooks in Azure Machine Learning Studio.
Two of the platforms that we see emerging as a popular combination of data warehousing and business intelligence are the Snowflake Data Cloud and Power BI. Debuting in 2015, Power BI has undergone meaningful updates that have made it a leader not just in datavisualization, but in the business intelligence space as well.
Link to event -> Generative AI and Data Storytelling Here are some of the key takeaways from the article: Generative AI is a type of artificial intelligence that can create new content, such as text, images, and music. Data storytelling is the process of using data to communicate a story in a way that is engaging and informative.
Dashboards, such as those built using Tableau or Power BI , provide real-time visualizations that help track key performance indicators (KPIs). Descriptive analytics is a fundamental method that summarizes past data using tools like Excel or SQL to generate reports. Data Scientists rely on technical proficiency.
As you’ll see below, however, a growing number of data analytics platforms, skills, and frameworks have altered the traditional view of what a data analyst is. Data Presentation: Communication Skills, DataVisualization Any good data analyst can go beyond just number crunching.
This includes skills in data cleaning, preprocessing, transformation, and exploratory data analysis (EDA). Familiarity with libraries like pandas, NumPy, and SQL for data handling is important. Additionally, knowledge of model evaluation, hyperparameter tuning, and model selection is valuable.
Data engineers are essential professionals responsible for designing, constructing, and maintaining an organization’s data infrastructure. They create data pipelines, ETL processes, and databases to facilitate smooth data flow and storage. DataVisualization: Matplotlib, Seaborn, Tableau, etc.
Lookers strength lies in its ability to connect to a wide variety of data sources. Examples include SQl, DWH, and Cloud based systems (Google Bigquery). With Looker, you can share dashboards and visualizations seamlessly across teams, providing stakeholders with access to real-time data.
They employ statistical methods and machine learning techniques to interpret data. Key Skills Expertise in statistical analysis and datavisualization tools. Proficiency in programming languages like Python and SQL. Key Skills Experience with cloud platforms (AWS, Azure). Experience with big data technologies (e.g.,
Basic knowledge of statistics is essential for data science. Statistics is broadly categorized into two types – Descriptive statistics – Descriptive statistics is describing the data. Visual graphs are the core of descriptive statistics. Use cases of data science. Learn when to use which technique.
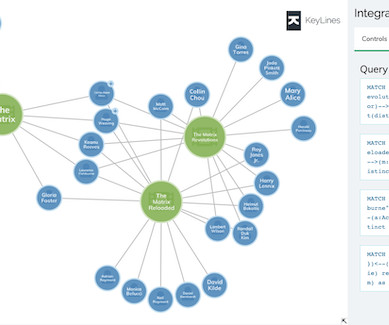
That’s why our datavisualization SDKs are database agnostic: so you’re free to choose the right stack for your application. Many of our customers successfully build fast and scalable graph visualization applications without a graph database. With data stored as a graph, it makes sense to query it as a graph too.
This comprehensive blog outlines vital aspects of Data Analyst interviews, offering insights into technical, behavioural, and industry-specific questions. It covers essential topics such as SQL queries, datavisualization, statistical analysis, machine learning concepts, and data manipulation techniques.
Responsibilities of a Data Analyst Data analysts, on the other hand, help businesses and organizations make data-driven decisions through their analytical skills. Their job is mainly to collect, process, analyze, and create detailed reports on data to meet business needs.
Preparing for the Future of Data Science Preparing for the future of Data Science involves developing essential skills, mastering advanced tools, and embracing continuous learning to navigate emerging trends and ethical challenges in this dynamic field. This foundational knowledge is essential for any Data Science project.
Computer Science and Computer Engineering Similar to knowing statistics and math, a data scientist should know the fundamentals of computer science as well. While knowing Python, R, and SQL is expected, youll need to go beyond that. Employers arent just looking for people who can program.
The University of Nottingham offers a Master of Science in Bioinformatics, which is aimed at students with a background in biological sciences who wish to develop skills in bioinformatics, statistics, computer programming , and Data Analytics. Skills Develop proficiency in programming languages like Python , R, and SQL.
Tools and Technologies Python/R: Popular programming languages for data analysis and machine learning. SQL (Structured Query Language): Language for managing and querying relational databases. Tableau/Power BI: Visualization tools for creating interactive and informative datavisualizations.
Data science methodologies and skills can be leveraged to design these experiments, analyze results, and iteratively improve prompt strategies. Using skills such as statistical analysis and datavisualization techniques, prompt engineers can assess the effectiveness of different prompts and understand patterns in the responses.
Power BI is a user-friendly and powerful datavisualization tool that enables individuals to easily create interactive reports and dashboards as well as centralized datasets. provide the necessary capabilities for Power BI to fold data transformation steps and perform incremental refresh efficiently.
Support for Numerous Data Sources: Fivetran supports over 200 data sources, including popular databases, applications, and cloud platforms like Salesforce, Google Analytics, SQL Server, Snowflake, and many more. Additionally, unsupported data sources can be integrated using Fivetran’s cloud function connectors.
Summary: Data engineering tools streamline data collection, storage, and processing. Tools like Python, SQL, Apache Spark, and Snowflake help engineers automate workflows and improve efficiency. Learning these tools is crucial for building scalable data pipelines.
We organize all of the trending information in your field so you don't have to. Join 17,000+ users and stay up to date on the latest articles your peers are reading.
You know about us, now we want to get to know you!
Let's personalize your content
Let's get even more personalized
We recognize your account from another site in our network, please click 'Send Email' below to continue with verifying your account and setting a password.


Let's personalize your content