This site uses cookies to improve your experience. To help us insure we adhere to various privacy regulations, please select your country/region of residence. If you do not select a country, we will assume you are from the United States. Select your Cookie Settings or view our Privacy Policy and Terms of Use.
Cookie Settings
Cookies and similar technologies are used on this website for proper function of the website, for tracking performance analytics and for marketing purposes. We and some of our third-party providers may use cookie data for various purposes. Please review the cookie settings below and choose your preference.
Used for the proper function of the website
Used for monitoring website traffic and interactions
Cookie Settings
Cookies and similar technologies are used on this website for proper function of the website, for tracking performance analytics and for marketing purposes. We and some of our third-party providers may use cookie data for various purposes. Please review the cookie settings below and choose your preference.
Strictly Necessary: Used for the proper function of the website
Performance/Analytics: Used for monitoring website traffic and interactions
PowerBI is a powerful data visualization tool that helps them turn raw data into meaningful insights and actionable decisions. In this blog, we will explore the role of data analysts and how they use PowerBI to extract insights from data and drive business success.
It offers full BI-Stack Automation, from source to data warehouse through to frontend. It also supports a wide range of data warehouses, analytical databases, data lakes, frontends, and pipelines/ETL. Data Lakes : It supports MS Azure Blob Storage. pipelines, Azure Data Bricks. pipelines, Azure Data Bricks.
PowerBI Desktop is a wonderful business intelligence tool that has an expansive list of reporting capabilities, but there is one thing that you aren’t able to do with it – create a paginated report, which is a specific style of report that is designed to be exported or printed. What Is PowerBI Report Builder?
Database Analyst Description Database Analysts focus on managing, analyzing, and optimizing data to support decision-making processes within an organization. They work closely with database administrators to ensure data integrity, develop reporting tools, and conduct thorough analyses to inform business strategies.
How to Optimize PowerBI and Snowflake for Advanced Analytics Spencer Baucke May 25, 2023 The world of business intelligence and data modernization has never been more competitive than it is today. Table of Contents Why Discuss Snowflake & PowerBI?
Microsoft Fabric combines multiple elements into a single platform – Image courtesy of Microsoft The contribution of PowerBI The integration of Microsoft PowerBI and Microsoft Fabric offers a powerful combination for organizations seeking comprehensive data analytics and insights.
They’ve tried to do this with the existing report created with PowerBI Desktop, and they can only see a small subset of the data from the table visualization when they export the report page as a PDF. In this blog post, we will introduce you to paginated reports in PowerBI and show you how to create one using PowerBI Report Builder.
PowerBI Desktop enables the connection and retrieval of data from various sources, followed by data transformation using Power Query. To address this challenge, Microsoft introduced Dataflows within the PowerBI service. What are Dataflows in PowerBI?
The Datamarts capability opens endless possibilities for organizations to achieve their data analytics goals on the PowerBI platform. Before we look into the PowerBI Datamarts, let us take a step back and understand the meaning of a Datamart. What is PowerBI Datamarts? in an enterprise data warehouse.
Summary: PowerBI is a business analytics tool transforming data into actionable insights. Key features include AI-powered analytics, extensive data connectivity, customisation options, and robust data modelling. Supports diverse data sources: Excel, SQL Server, Azure, and more. Why PowerBI?
Summary : Microsoft Fabric is an end-to-end Data Analytics platform designed for integration, processing, and advanced insights, while PowerBI excels in creating interactive visualisations and reports. Key Takeaways Microsoft Fabric is a full-scale data platform, while PowerBI focuses on visualising insights.
Summary: Data Visualisation is crucial to ensure effective representation of insights tableau vs powerbi are two popular tools for this. This article compares Tableau and PowerBI, examining their features, pricing, and suitability for different organisations. What is PowerBI? billion in 2023.
Summary: PowerBI is a leading data analytics platform offering advanced features like real-time analytics and collaborative capabilities. Understanding its significance is vital for aspiring PowerBI developers. Mastering PowerBI can significantly enhance career prospects, given its prevalence in the industry.
PowerBI is a user-friendly and powerful data visualization tool that enables individuals to easily create interactive reports and dashboards as well as centralized datasets. In this blog, we will explain the difference between Full Refresh & Incremental Refresh and how to implement Incremental refresh in PowerBI.
In addition to Business Intelligence (BI), Process Mining is no longer a new phenomenon, but almost all larger companies are conducting this data-driven process analysis in their organization. This aspect can be applied well to Process Mining, hand in hand with BI and AI.
PowerBI Datamarts is one of the most exciting features that Microsoft has released for the Power Platform in recent years. If you need high-level information on what a PowerBI Datamart is and some example use cases, check out our other blog, What Are PowerBI Datamarts?
Explore, analyze, and visualize data with our Introduction to PowerBI training & make data-driven decisions. 2. Building Enterprise-Grade Q&A Chatbots with Azure OpenAI: In this tutorial, we explore the features of Azure OpenAI and demonstrate how to further improve the platform by fine-tuning some of its models.
OnPrem - Geospatial database D2. OnPrem - SAP database D4. OnCloud - Large mirror database D10. OnPrem - LotusNotes database D11. OnPrem - IBM BPM database D12. In 2000s many of our systems were built on top of IBM Lotus Notes databases. OnCloud - Geospatial mirror D3. OnPrem - File System D13.
Defining Cloud Computing in Data Science Cloud computing provides on-demand access to computing resources such as servers, storage, databases, and software over the Internet. Managed services like AWS Lambda and Azure Data Factory streamline data pipeline creation, while pre-built ML models in GCPs AI Hub reduce development time.
Summary: This blog provides a comprehensive roadmap for aspiring Azure Data Scientists, outlining the essential skills, certifications, and steps to build a successful career in Data Science using Microsoft Azure. This roadmap aims to guide aspiring Azure Data Scientists through the essential steps to build a successful career.
Wide Range of Data Sources : Connects to databases, spreadsheets, and Big Data platforms. Microsoft PowerBIPowerBI is a business analytics service by Microsoft that provides interactive visualizations and business intelligence capabilities with an interface simple enough for end users to create their own reports and dashboards.
Tools like Tableau, PowerBI, and Python libraries such as Matplotlib and Seaborn are commonly taught. Databases and SQL : Managing and querying relational databases using SQL, as well as working with NoSQL databases like MongoDB. R : Often used for statistical analysis and data visualization.
It’s a foundational skill for working with relational databases Just about every data scientist or analyst will have to work with relational databases in their careers. Another boon for efficient work that SQL provides is its simple and consistent syntax that allows for collaboration across multiple databases.
Popular tools like PowerBI, Tableau, and Google Data Studio offer unique features for Data Analysis. Common tools like Tableau, PowerBI, and Google Data Studio enable businesses to create dynamic visualisations that simplify complex datasets. These visual representations help users quickly identify trends and patterns.
Familiarity with Databases; SQL for structured data, and NOSQL for unstructured data. Experience with cloud platforms like; AWS, AZURE, etc. Experience with visualization tools like; Tableau and PowerBI. High proficiency in visualization tools like; Tableau, Google Studio, and PowerBI.
Data Wrangling: Data Quality, ETL, Databases, Big Data The modern data analyst is expected to be able to source and retrieve their own data for analysis. Competence in data quality, databases, and ETL (Extract, Transform, Load) are essential. Cloud Services: Google Cloud Platform, AWS, Azure.
Some of the key tools used for sequence analysis include: BLAST (Basic Local Alignment Search Tool) BLAST compares a query sequence with a database of known sequences to identify similar regions. PowerBIPowerBI is a business analytics tool that allows researchers to create interactive dashboards and reports.
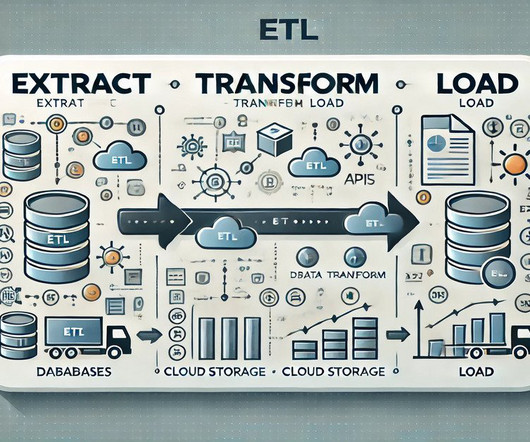
The first step in the ETL process is extraction, where data is gathered from different sources, such as databases, cloud services, or flat files. Its ability to integrate with cloud platforms like AWS and Azure makes it an excellent choice for businesses moving to the cloud.
This includes structured data (like databases), semi-structured data (like XML files), and unstructured data (like text documents and videos). Cloud Storage: Services like Amazon S3, Google Cloud Storage, and Microsoft Azure Blob Storage provide scalable storage solutions that can accommodate massive datasets with ease.
This includes structured data (like databases), semi-structured data (like XML files), and unstructured data (like text documents and videos). Cloud Storage: Services like Amazon S3, Google Cloud Storage, and Microsoft Azure Blob Storage provide scalable storage solutions that can accommodate massive datasets with ease.
More on this topic later; but for now, keep in mind that the simplest method is to create a naming convention for database objects that allows you to identify the owner and associated budget. You can set this value for each database and choose to have non-production data stored for fewer days. authorization server.
They create data pipelines, ETL processes, and databases to facilitate smooth data flow and storage. Their primary responsibilities include: Data Collection and Preparation Data Scientists start by gathering relevant data from various sources, including databases, APIs, and online platforms. ETL Tools: Apache NiFi, Talend, etc.
SQL stands for Structured Query Language, essential for querying and manipulating data stored in relational databases. The SELECT statement retrieves data from a database, while SELECT DISTINCT eliminates duplicate rows from the result set. Have you worked with cloud-based data platforms like AWS, Google Cloud, or Azure?
🌵 ♬ use this audio if im the best editor oat – alpine Wolfram Alpha : Wolfram Alpha is a computational knowledge engine that can answer any question or query using its vast database of facts and algorithms. You can use Diffbot to build your own custom databases or APIs for any purpose.
There is a plethora of BI tools available in the market today, with new ones being added yearly. Through a comparative analysis of some of the leading BI tools: Google Looker, Microsoft PowerBI, Tableau and Qlik Sense, discover which BI solution best fits your organization’s data analytics needs to empower informed decision-making.
Focus on Python and R for Data Analysis, along with SQL for database management. Learn to use tools like Tableau, PowerBI, or Matplotlib to create compelling visual representations of data. Familiarise yourself with cloud platforms like AWS, Google Cloud Platform , or Microsoft Azure for storing and processing large datasets.
Understanding Data Structured Data: Organized data with a clear format, often found in databases or spreadsheets. SQL (Structured Query Language): Language for managing and querying relational databases. Tableau/PowerBI: Visualization tools for creating interactive and informative data visualizations.
We all know how easy it is to refresh a single table in PowerBI Desktop by right-clicking the table and selecting Refresh Data. However, in PowerBI Service, we can only refresh the entire semantic model, as there is no out-of-the-box solution for refreshing a single table. By refreshing only the relevant table (e.g.,
A data engineer creates and manages the pipelines that transfer data from different sources to databases or cloud storage. Data Storage : Keeping data safe in databases or cloud platforms. It allows them to retrieve, manipulate, and manage structured data in relational databases. What Does a Data Engineer Do?
We organize all of the trending information in your field so you don't have to. Join 17,000+ users and stay up to date on the latest articles your peers are reading.
You know about us, now we want to get to know you!
Let's personalize your content
Let's get even more personalized
We recognize your account from another site in our network, please click 'Send Email' below to continue with verifying your account and setting a password.


Let's personalize your content