This site uses cookies to improve your experience. To help us insure we adhere to various privacy regulations, please select your country/region of residence. If you do not select a country, we will assume you are from the United States. Select your Cookie Settings or view our Privacy Policy and Terms of Use.
Cookie Settings
Cookies and similar technologies are used on this website for proper function of the website, for tracking performance analytics and for marketing purposes. We and some of our third-party providers may use cookie data for various purposes. Please review the cookie settings below and choose your preference.
Used for the proper function of the website
Used for monitoring website traffic and interactions
Cookie Settings
Cookies and similar technologies are used on this website for proper function of the website, for tracking performance analytics and for marketing purposes. We and some of our third-party providers may use cookie data for various purposes. Please review the cookie settings below and choose your preference.
Strictly Necessary: Used for the proper function of the website
Performance/Analytics: Used for monitoring website traffic and interactions
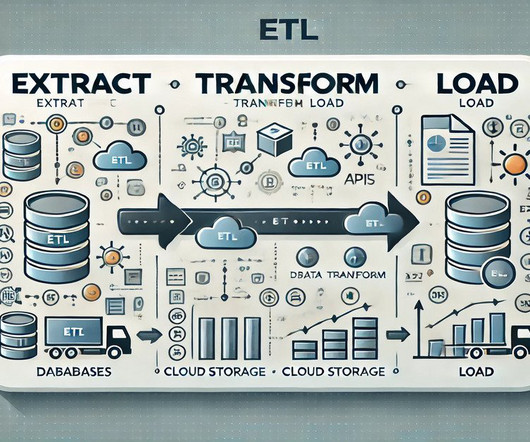
It also supports a wide range of data warehouses, analytical databases, data lakes, frontends, and pipelines/ETL. Support for Various Data Warehouses and Databases : AnalyticsCreator supports MS SQL Server 2012-2022, Azure SQL Database, Azure Synapse Analytics dedicated, and more. Data Lakes : It supports MS Azure Blob Storage.
Vielfältige Unterstützung: Kompatibel mit verschiedenen Datenbankmanagementsystemen wie MS SQL Server und Azure Synapse Analytics. Data Lakes: Unterstützt MS Azure Blob Storage. Frontends : Kompatibel mit Tools wie PowerBI, Qlik Sense und Tableau.
PowerBI Desktop enables the connection and retrieval of data from various sources, followed by data transformation using Power Query. To address this challenge, Microsoft introduced Dataflows within the PowerBI service. What are Dataflows in PowerBI?
The Datamarts capability opens endless possibilities for organizations to achieve their data analytics goals on the PowerBI platform. Before we look into the PowerBI Datamarts, let us take a step back and understand the meaning of a Datamart. What is PowerBI Datamarts?
Summary : Microsoft Fabric is an end-to-end Data Analytics platform designed for integration, processing, and advanced insights, while PowerBI excels in creating interactive visualisations and reports. Key Takeaways Microsoft Fabric is a full-scale data platform, while PowerBI focuses on visualising insights.
Summary: Selecting the right ETL platform is vital for efficient data integration. Introduction In today’s data-driven world, businesses rely heavily on ETL platforms to streamline data integration processes. What is ETL in Data Integration? Let’s explore some real-world applications of ETL in different sectors.
PowerBI Datamarts is one of the most exciting features that Microsoft has released for the Power Platform in recent years. If you need high-level information on what a PowerBI Datamart is and some example use cases, check out our other blog, What Are PowerBI Datamarts?
Key Skills Proficiency in SQL is essential, along with experience in data visualization tools such as Tableau or PowerBI. Strong analytical skills and the ability to work with large datasets are critical, as is familiarity with data modeling and ETL processes.
Tools like Tableau, PowerBI, and Python libraries such as Matplotlib and Seaborn are commonly taught. Data Engineering : Building and maintaining data pipelines, ETL (Extract, Transform, Load) processes, and data warehousing. R : Often used for statistical analysis and data visualization.
Users can quickly identify key trends, outliers , and data relationships, making it easier to make informed decisions based on comprehensive, AI-powered analysis. Power Query Power Query is another transformative AI tool that simplifies data extraction, transformation, and loading ( ETL ).
Data Wrangling: Data Quality, ETL, Databases, Big Data The modern data analyst is expected to be able to source and retrieve their own data for analysis. Competence in data quality, databases, and ETL (Extract, Transform, Load) are essential. Cloud Services: Google Cloud Platform, AWS, Azure.
One set of tools that are becoming more important in our data-driven world is BI tools. Think of Tableau, PowerBI, and QlikView. These are used to extract, transform, and load (ETL) data between different systems. Each of these creates visualizations and reports based on data stored in a database.
They create data pipelines, ETL processes, and databases to facilitate smooth data flow and storage. Data Integration and ETL (Extract, Transform, Load) Data Engineers develop and manage data pipelines that extract data from various sources, transform it into a suitable format, and load it into the destination systems.
Data Warehousing and ETL Processes What is a data warehouse, and why is it important? Explain the Extract, Transform, Load (ETL) process. The ETL process involves extracting data from source systems, transforming it into a suitable format or structure, and loading it into a data warehouse or target system for analysis and reporting.
We organize all of the trending information in your field so you don't have to. Join 17,000+ users and stay up to date on the latest articles your peers are reading.
You know about us, now we want to get to know you!
Let's personalize your content
Let's get even more personalized
We recognize your account from another site in our network, please click 'Send Email' below to continue with verifying your account and setting a password.
Let's personalize your content