This site uses cookies to improve your experience. To help us insure we adhere to various privacy regulations, please select your country/region of residence. If you do not select a country, we will assume you are from the United States. Select your Cookie Settings or view our Privacy Policy and Terms of Use.
Cookie Settings
Cookies and similar technologies are used on this website for proper function of the website, for tracking performance analytics and for marketing purposes. We and some of our third-party providers may use cookie data for various purposes. Please review the cookie settings below and choose your preference.
Used for the proper function of the website
Used for monitoring website traffic and interactions
Cookie Settings
Cookies and similar technologies are used on this website for proper function of the website, for tracking performance analytics and for marketing purposes. We and some of our third-party providers may use cookie data for various purposes. Please review the cookie settings below and choose your preference.
Strictly Necessary: Used for the proper function of the website
Performance/Analytics: Used for monitoring website traffic and interactions
Summary: BigData visualization involves representing large datasets graphically to reveal patterns, trends, and insights that are not easily discernible from raw data. quintillion bytes of data daily, the need for effective visualization techniques has never been greater. As we generate approximately 2.5
While different companies, regardless of their size, have different operational processes, they share a common need for actionable insight to drive success in their business. Advancement in bigdata technology has made the world of business even more competitive. Make better business decisions. Boost revenue.
More and more often, businesses are using data to drive their decisions — which makes cutting-edge analytics and businessintelligence strategies one of the best advantages a company can have. Here are the six trends you should be aware of that will reshape businessintelligence in 2020 and throughout the new decade.
As the use of intelligence technologies is staggering, knowing the latest trends in businessintelligence is a must. The market for businessintelligence services is expected to reach $33.5 top 5 key platforms that control the future of businessintelligence impacts BI may have on your business in the future.
It integrates seamlessly with other AWS services and supports various data integration and transformation workflows. Google BigQuery: Google BigQuery is a serverless, cloud-based data warehouse designed for bigdata analytics. It provides a scalable and fault-tolerant ecosystem for bigdata processing.
Big or small, every business needs good tools to analyze data and develop the most suitable business strategy based on the information they get. Businessintelligence tools are means that help companies get insights from their data and get a better understanding of what directions and trends to follow.
Companies use BusinessIntelligence (BI), Data Science , and Process Mining to leverage data for better decision-making, improve operational efficiency, and gain a competitive edge. Data Mesh on Azure Cloud with Databricks and Delta Lake for Applications of BusinessIntelligence, Data Science and Process Mining.
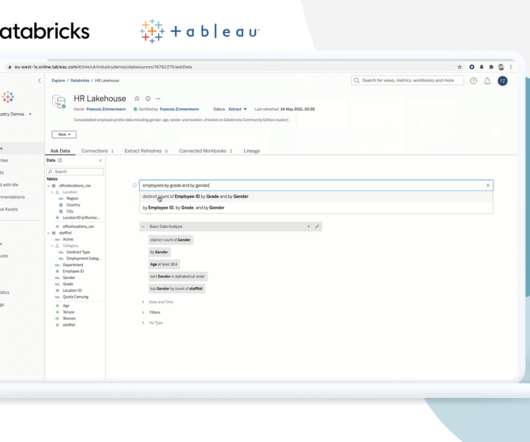
EMEA Field CTO, Tableau. In many of the conversations we have with IT and business leaders, there is a sense of frustration about the speed of time-to-value for bigdata and data science projects. The division between data lakes and data warehouses is stifling innovation. Francois Zimmermann.
Summary: Data Visualisation is crucial to ensure effective representation of insights tableau vs power bi are two popular tools for this. This article compares Tableau and Power BI, examining their features, pricing, and suitability for different organisations. What is Tableau? billion in 2023. from 2022 to 2028.
Business reporting has been around for a long time but the tools and techniques of businessintelligence have refined over time and now with the recent popularity of data driven business approach, data has been identified as the most valuable asset of a business and data analytics and reporting has finally found a key place in the business world.
In addition to BusinessIntelligence (BI), Process Mining is no longer a new phenomenon, but almost all larger companies are conducting this data-driven process analysis in their organization. The Event Log Data Model for Process Mining Process Mining as an analytical system can very well be imagined as an iceberg.
Summary: BusinessIntelligence tools are software applications that help organizations collect, process, analyse, and visualize data from various sources. Introduction BusinessIntelligence (BI) tools are essential for organizations looking to harness data effectively and make informed decisions.
Introduction In the rapidly evolving landscape of data analytics, BusinessIntelligence (BI) tools have become indispensable for organizations seeking to leverage their bigdata stores for strategic decision-making. There is a plethora of BI tools available in the market today, with new ones being added yearly.
Summary: Understanding BusinessIntelligence Architecture is essential for organizations seeking to harness data effectively. This framework includes components like data sources, integration, storage, analysis, visualization, and information delivery. What is BusinessIntelligence Architecture?
Summary: BigData encompasses vast amounts of structured and unstructured data from various sources. Key components include data storage solutions, processing frameworks, analytics tools, and governance practices. Key Takeaways BigData originates from diverse sources, including IoT and social media.
Data can help them create strategies based on these powerful forces. The good news is that it’s never been easier to collect and organize data. In the early days of analytics, only the largest companies could afford to leverage bigdata. All that’s changed and now there are accessible tools for businesses of all sizes.
Summary: BigData encompasses vast amounts of structured and unstructured data from various sources. Key components include data storage solutions, processing frameworks, analytics tools, and governance practices. Key Takeaways BigData originates from diverse sources, including IoT and social media.
Tableau is a data visualisation software helping you to generate graphics-rich reporting and analysing enormous volumes of data. With the help of Tableau, organisations have been able to mine and gather actionable insights from granular sources of data. Let’s read the blog to find out!
The e-commerce giant leverages Tableau and the Alation Data Catalog to create a seamless process of data discovery and analysis with the goal of enabling all of its 7,500+ employees with self-service analytics. MercadoLibre’s journey to democratizing data began five years ago. million sellers and 267 million users.
We’re well past the point of realization that bigdata and advanced analytics solutions are valuable — just about everyone knows this by now. Bigdata alone has become a modern staple of nearly every industry from retail to manufacturing, and for good reason. Basic BusinessIntelligence Experience is a Must.
” Data visualization and communication It’s not enough to uncover insights from data; a data scientist must also communicate these insights effectively. This is where data visualization comes in. Tools like Tableau, Matplotlib, Seaborn, or Power BI can be incredibly helpful.
EMEA Field CTO, Tableau. In many of the conversations we have with IT and business leaders, there is a sense of frustration about the speed of time-to-value for bigdata and data science projects. The division between data lakes and data warehouses is stifling innovation. Francois Zimmermann.
Overview There are a plethora of data science tools out there – which one should you pick up? The post 22 Widely Used Data Science and Machine Learning Tools in 2020 appeared first on Analytics Vidhya. Here’s a list of over 20.
The e-commerce giant leverages Tableau and the Alation Data Catalog to create a seamless process of data discovery and analysis with the goal of enabling all […]. The post MercadoLibre grows governed, self-service analytics with Alation and Tableau appeared first on Alation. million sellers and 267 million users.
The application of Artificial intelligence and BusinessIntelligence in affiliate marketing has been actively discussed for quite a time. In AI it refers to computer intelligence, while in BI it is about smart decision-making in business influenced by data analysis and visualization. BusinessIntelligence.
. ; there has to be a business context, and the increasing realization of this context explains the rise of information stewardship applications.” – May 2018 Gartner Market Guide for Information Stewardship Applications. The rise of data lakes, IOT analytics, and bigdata pipelines has introduced a new world of fast, bigdata.
In addition to supporting standard SQL, Apache Drill lets you keep depending on businessintelligence tools you may already use, such as Qlik and Tableau. Also, no matter your current skill level with bigdata analysis, Apache Drill tries to remove some of the obstacles that people often face.
Summary: Power BI alternatives like Tableau, Qlik Sense, and Zoho Analytics provide businesses with tailored Data Analysis and Visualisation solutions. Selecting the right alternative ensures efficient data-driven decision-making and aligns with your organisation’s goals and budget. billion to USD 54.27 What is Power BI?
Sometimes, it can be hard to spot aspects of a business that aren’t running as smoothly as they could be. For this reason, exploring data visualization can come in handy. Google Charts to Tableau, there are so many tools and analytics software options available for your business to thrive. Understanding employees.
BusinessIntelligence used to require months of effort from BI and ETL teams. Today, you have Tableau, empowering any analyst to create a report. Today, any data scientist, business analyst or business person can use Trifacta to transform, prepare, and move data. Now you have iPhones and YouTube.
Data analytics is a task that resides under the data science umbrella and is done to query, interpret and visualize datasets. Data scientists will often perform data analysis tasks to understand a dataset or evaluate outcomes. And you should have experience working with bigdata platforms such as Hadoop or Apache Spark.
A typical modern data stack consists of the following: A data warehouse. Data ingestion/integration services. Data orchestration tools. Businessintelligence (BI) platforms. These tools are used to manage bigdata, which is defined as data that is too large or complex to be processed by traditional means.
Who says you can’t rock and roll with data? For the second year in a row, Dresner Advisory Services’ Wisdom of Crowds® Data Catalog Market Study 7 named Alation as the top-ranked data cataloging solution. Ventana Research’s 2018 Digital Innovation Award for BigData.
Business analysts are concerned with looking at data and events, making sure negative events do not occur again and choosing and implementing solutions to ensure that this is the case. This is a field in which demand is increasing as many companies turn to using bigdata analysis , and they require experts who know how to do this.
However, Data Scientists use tools like Python, Java, and Machine Learning for manipulating and analysing data. Significantly, in contrast, Data Analysts utilise their proficiency in a relational databases, BusinessIntelligence programs and statistical software.
SAS (Statistical Analysis System) This comprehensive software suite enables advanced analytics, businessintelligence, and data management. It is particularly strong in data manipulation and statistical analysis, making it a staple in many industries, including healthcare and finance.
His focus is on businessintelligence, analytics, bigdata, and data warehousing. They’re thinking immediately how they’re going to report it, how they’re going to show it in Tableau, and where the data is going to come from to prove out that it’s working successfully. It’s drag and drop.
The Three Types of Data Science Data science isn’t a one-size-fits-all solution. There are three main types, each serving a distinct purpose: Descriptive Analytics (BusinessIntelligence): This focuses on understanding what happened. Hadoop/Spark: Frameworks for distributed storage and processing of bigdata.
Artificial Intelligence (AI): Enables machines to perform tasks that require human intelligence, such as recognising speech, translating languages, or driving autonomous cars. BigData: Refers to vast sets of data that traditional tools cannot process; commonly used in industries like social media, e-commerce, and healthcare.
Price Optimization Software Tools like PROS or Vendavo use advanced algorithms to analyse historical sales data and predict optimal prices based on various factors such as demand elasticity and competitor actions.
The requirement of SQL in Data Science is to conduct analytical performances on data that are stored in relational databases. While using BigData Tools, Data Scientists need SQL which helps them in Data Wrangling and preparation.
As data accumulates across various platforms and locations, it can lead to confusion regarding what data exists, where it is stored, and how it should be utilized. Data Quality Issues Maintaining high-quality data is a persistent challenge.
A data warehouse is a centralised repository that consolidates data from various sources for reporting and analysis. It is essential to provide a unified data view and enable businessintelligence and analytics. Industry-specific Tools and Technologies Questions Are you familiar with any data visualisation tools?
BigData tauchte als Buzzword meiner Recherche nach erstmals um das Jahr 2011 relevant in den Medien auf. BigData wurde zum Business-Sprech der darauffolgenden Jahre. In der Parallelwelt der ITler wurde das Tool und Ökosystem Apache Hadoop quasi mit BigData beinahe synonym gesetzt.
We organize all of the trending information in your field so you don't have to. Join 17,000+ users and stay up to date on the latest articles your peers are reading.
You know about us, now we want to get to know you!
Let's personalize your content
Let's get even more personalized
We recognize your account from another site in our network, please click 'Send Email' below to continue with verifying your account and setting a password.


Let's personalize your content