This site uses cookies to improve your experience. To help us insure we adhere to various privacy regulations, please select your country/region of residence. If you do not select a country, we will assume you are from the United States. Select your Cookie Settings or view our Privacy Policy and Terms of Use.
Cookie Settings
Cookies and similar technologies are used on this website for proper function of the website, for tracking performance analytics and for marketing purposes. We and some of our third-party providers may use cookie data for various purposes. Please review the cookie settings below and choose your preference.
Used for the proper function of the website
Used for monitoring website traffic and interactions
Cookie Settings
Cookies and similar technologies are used on this website for proper function of the website, for tracking performance analytics and for marketing purposes. We and some of our third-party providers may use cookie data for various purposes. Please review the cookie settings below and choose your preference.
Strictly Necessary: Used for the proper function of the website
Performance/Analytics: Used for monitoring website traffic and interactions
With the mantra, “A new day for data”, the theme of Salesforce’s Tableau Conference in Las Vegas this week, Salesforce gives Tableaudata analysis and visualization platform the power of generative AI, and launches Tableau Pulse to make data less daunting.
Summary: BigData visualization involves representing large datasets graphically to reveal patterns, trends, and insights that are not easily discernible from raw data. quintillion bytes of data daily, the need for effective visualization techniques has never been greater. As we generate approximately 2.5
BigData tauchte als Buzzword meiner Recherche nach erstmals um das Jahr 2011 relevant in den Medien auf. BigData wurde zum Business-Sprech der darauffolgenden Jahre. In der Parallelwelt der ITler wurde das Tool und Ökosystem Apache Hadoop quasi mit BigData beinahe synonym gesetzt.
Their role is crucial in understanding the underlying data structures and how to leverage them for insights. Key Skills Proficiency in SQL is essential, along with experience in data visualization tools such as Tableau or Power BI.
Data can be complicated to collect and it is often even more complex to understand in a way that brings a business value. Salesforce’s Tableau business unit today announced the 2023.1 release of its enterprise platform known as Tableau Server, which can run on-premises or in an organization’s own …
In Tableau 2021.1, we’ve added new connectors to help our customers access more data in Azure than ever before: an Azure SQL Database connector and an Azure Data Lake Storage Gen2 connector. As our customers increasingly adopt the cloud, we continue to make investments that ensure they can access their data anywhere.
It integrates seamlessly with other AWS services and supports various data integration and transformation workflows. Google BigQuery: Google BigQuery is a serverless, cloud-based data warehouse designed for bigdata analytics. It provides a scalable and fault-tolerant ecosystem for bigdata processing.
This article was published as a part of the Data Science Blogathon. Introduction Data Engineering Tools Data Engineering is a growing sector that’s gaining a lot of attention as new technology creates more and more influx of BigData.
Python, R, and SQL: These are the most popular programming languages for data science. Libraries and Tools: Libraries like Pandas, NumPy, Scikit-learn, Matplotlib, Seaborn, and Tableau are like specialized tools for data analysis, visualization, and machine learning. This is like dusting off the clues before examining them.
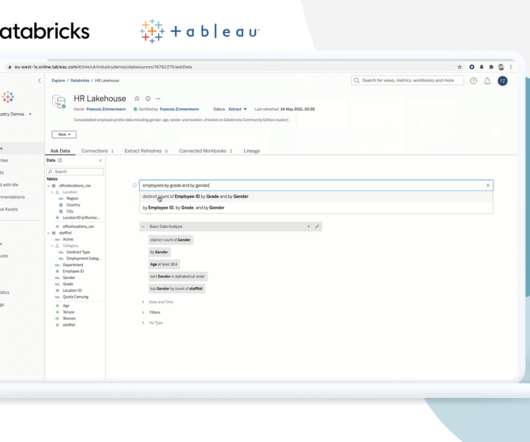
EMEA Field CTO, Tableau. In many of the conversations we have with IT and business leaders, there is a sense of frustration about the speed of time-to-value for bigdata and data science projects. The division between data lakes and data warehouses is stifling innovation. Francois Zimmermann. Brian Dirking.
After months of searching the sanctuary—a pristine wilderness that’s double the size of Chicago—they pull up their Tableau dashboard. Fed by data compiled from EarthRanger, a wildlife management and protection tool, the rangers discover an area unchecked. Park rangers becoming data pioneers.
Tableau, TIBCO Data Science, IBM and Sisense are among the best software for predictive analytics. Explore their features, pricing, pros and cons to find the best option for your organization.
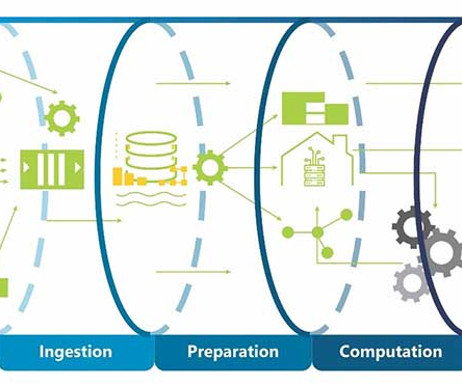
With the explosive growth of bigdata over the past decade and the daily surge in data volumes, it’s essential to have a resilient system to manage the vast influx of information without failures. The success of any data initiative hinges on the robustness and flexibility of its bigdata pipeline.
Python, R, and SQL: These are the most popular programming languages for data science. Libraries and Tools: Libraries like Pandas, NumPy, Scikit-learn, Matplotlib, Seaborn, and Tableau are like specialized tools for data analysis, visualization, and machine learning. This is like dusting off the clues before examining them.
Summary: A comprehensive BigData syllabus encompasses foundational concepts, essential technologies, data collection and storage methods, processing and analysis techniques, and visualisation strategies. Fundamentals of BigData Understanding the fundamentals of BigData is crucial for anyone entering this field.
Two tools that have significantly impacted the data analytics landscape are KNIME and Tableau. KNIME Analytics Platform is an open-source data analytics tool that enables users to manage, process, and analyze data through a visual, user-friendly interface. You can read more about the KNIME Tableau Integration here.
Summary: BigData revolutionises promotional strategies by enabling personalised, data-driven marketing campaigns. Businesses leveraging BigData effectively gain a competitive edge in connecting with audiences and optimising campaign performance while fostering trust through responsible data use.
Summary: BigData encompasses vast amounts of structured and unstructured data from various sources. Key components include data storage solutions, processing frameworks, analytics tools, and governance practices. Key Takeaways BigData originates from diverse sources, including IoT and social media.
Advancement in bigdata technology has made the world of business even more competitive. The proper use of business intelligence and analytical data is what drives big brands in a competitive market. This high-end data visualization makes data exploration more accessible to end-users.
Summary: BigData encompasses vast amounts of structured and unstructured data from various sources. Key components include data storage solutions, processing frameworks, analytics tools, and governance practices. Key Takeaways BigData originates from diverse sources, including IoT and social media.
A bigdata architecture blueprint is a plan for managing and using large amounts of information. Here are the main steps involved in creating a bigdata architecture blueprint: 1. Identify the business problem or use case : Start by identifying the business problem or use case that you want to solve with bigdata.
Tableau is a data visualisation software helping you to generate graphics-rich reporting and analysing enormous volumes of data. With the help of Tableau, organisations have been able to mine and gather actionable insights from granular sources of data. Let’s read the blog to find out!
Summary: Data Visualisation is crucial to ensure effective representation of insights tableau vs power bi are two popular tools for this. This article compares Tableau and Power BI, examining their features, pricing, and suitability for different organisations. What is Tableau? billion in 2023. from 2022 to 2028.
In Tableau 2021.1, we’ve added new connectors to help our customers access more data in Azure than ever before: an Azure SQL Database connector and an Azure Data Lake Storage Gen2 connector. As our customers increasingly adopt the cloud, we continue to make investments that ensure they can access their data anywhere.
Bigdata tools are incredibly important for the survival of modern businesses. The best companies tend to invest in the highest quality bigdata technology to gain a competitive advantage in their market. They need to do their due diligence and find ways to make the most of the bigdata technology at their disposal.
Data can help them create strategies based on these powerful forces. The good news is that it’s never been easier to collect and organize data. In the early days of analytics, only the largest companies could afford to leverage bigdata. Data Science: Harnessing the Power of BigData.
The e-commerce giant leverages Tableau and the Alation Data Catalog to create a seamless process of data discovery and analysis with the goal of enabling all […]. The post MercadoLibre grows governed, self-service analytics with Alation and Tableau appeared first on Alation. million sellers and 267 million users.
EMEA Field CTO, Tableau. In many of the conversations we have with IT and business leaders, there is a sense of frustration about the speed of time-to-value for bigdata and data science projects. The division between data lakes and data warehouses is stifling innovation. Francois Zimmermann. Brian Dirking.
Just as companies are becoming more aware of the value of data, so are hackers — and as a result, the frequency and cost of data breaches are beginning to skyrocket. In the future, companies that come to rely on these new data sources will also need to protect that data — or risk the consequences.
After months of searching the sanctuary—a pristine wilderness that’s double the size of Chicago—they pull up their Tableau dashboard. Fed by data compiled from EarthRanger, a wildlife management and protection tool, the rangers discover an area unchecked. Park rangers becoming data pioneers.
Business reporting has been around for a long time but the tools and techniques of business intelligence have refined over time and now with the recent popularity of data driven business approach, data has been identified as the most valuable asset of a business and data analytics and reporting has finally found a key place in the business world.
Key Tools and Techniques Business Analytics employs various tools and techniques to process and interpret data effectively. Dashboards, such as those built using Tableau or Power BI , provide real-time visualizations that help track key performance indicators (KPIs). Data Scientists require a robust technical foundation.
Summary: “Data Science in a Cloud World” highlights how cloud computing transforms Data Science by providing scalable, cost-effective solutions for bigdata, Machine Learning, and real-time analytics. This accessibility democratises Data Science, making it available to businesses of all sizes.
Overview There are a plethora of data science tools out there – which one should you pick up? The post 22 Widely Used Data Science and Machine Learning Tools in 2020 appeared first on Analytics Vidhya. Here’s a list of over 20.
The trend towards powerful in-house cloud platforms for data and analysis ensures that large volumes of data can increasingly be stored and used flexibly. New bigdata architectures and, above all, data sharing concepts such as Data Mesh are ideal for creating a common database for many data products and applications.
First, the amount of data available to organizations has grown exponentially in recent years, creating a need for professionals who can make sense of it. Second, advancements in technology, such as bigdata and machine learning, have made it easier and more efficient to analyze data.
” Data visualization and communication It’s not enough to uncover insights from data; a data scientist must also communicate these insights effectively. This is where data visualization comes in. Tools like Tableau, Matplotlib, Seaborn, or Power BI can be incredibly helpful.
We’re well past the point of realization that bigdata and advanced analytics solutions are valuable — just about everyone knows this by now. Bigdata alone has become a modern staple of nearly every industry from retail to manufacturing, and for good reason. But it’s not the only skill necessary to thrive.
BigData As datasets become larger and more complex, knowing how to work with them will be key. Bigdata isn’t an abstract concept anymore, as so much data comes from social media, healthcare data, and customer records, so knowing how to parse all of that is needed.
Ateken Abla April 3, 2024 - 10:38pm Danika Harrod Marketing Manager, Community Content & Events, Tableau Chris Westlake fell in love with Tableau from the get-go. “I It was the fun crossover between data and creativity that I didn’t even realize I was looking for. I love Tableau User Groups!
In addition to supporting standard SQL, Apache Drill lets you keep depending on business intelligence tools you may already use, such as Qlik and Tableau. Also, no matter your current skill level with bigdata analysis, Apache Drill tries to remove some of the obstacles that people often face.
Business intelligence software will be more geared towards working with BigData. Data Governance. One issue that many people don’t understand is data governance. It is evident that challenges of data handling will be present in the future too. Below we break down the latest trends in business intelligence.
Architecturally the introduction of Hadoop, a file system designed to store massive amounts of data, radically affected the cost model of data. Organizationally the innovation of self-service analytics, pioneered by Tableau and Qlik, fundamentally transformed the user model for data analysis. The Rise of the Data Catalog.
Automating your data processing routine can offer your business a lot of benefits. BI tools use the BigData approach and apply it to your company data. Tableau Desktop. Tableau Desktop is an end-to-end solution that can help you understand your business data better. Get Real-Time Analysis.
We organize all of the trending information in your field so you don't have to. Join 17,000+ users and stay up to date on the latest articles your peers are reading.
You know about us, now we want to get to know you!
Let's personalize your content
Let's get even more personalized
We recognize your account from another site in our network, please click 'Send Email' below to continue with verifying your account and setting a password.


Let's personalize your content