This site uses cookies to improve your experience. To help us insure we adhere to various privacy regulations, please select your country/region of residence. If you do not select a country, we will assume you are from the United States. Select your Cookie Settings or view our Privacy Policy and Terms of Use.
Cookie Settings
Cookies and similar technologies are used on this website for proper function of the website, for tracking performance analytics and for marketing purposes. We and some of our third-party providers may use cookie data for various purposes. Please review the cookie settings below and choose your preference.
Used for the proper function of the website
Used for monitoring website traffic and interactions
Cookie Settings
Cookies and similar technologies are used on this website for proper function of the website, for tracking performance analytics and for marketing purposes. We and some of our third-party providers may use cookie data for various purposes. Please review the cookie settings below and choose your preference.
Strictly Necessary: Used for the proper function of the website
Performance/Analytics: Used for monitoring website traffic and interactions
Das Format Business Talk am Kudamm in Berlin führte ein Interview mit Benjamin Aunkofer zum Thema “BusinessIntelligence und Process Mining nachhaltig umsetzen”. 3 – Bei der Nutzung von Daten fallen oft die Begriffe „Process Mining“ und „BusinessIntelligence“. appeared first on Data Science Blog.
PowerBI Desktop is a wonderful businessintelligence tool that has an expansive list of reporting capabilities, but there is one thing that you aren’t able to do with it – create a paginated report, which is a specific style of report that is designed to be exported or printed. What Is PowerBI Report Builder?
Row-level security is a powerful data governance capability across many businessintelligence platforms, and PowerBI is no exception. Learning how to implement row-level security is critical for any PowerBI developer hoping to add an extra layer of security to their reports and datasets.
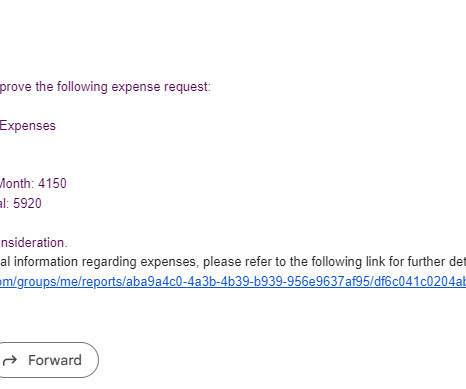
By integrating Power Automate workflows with your PowerBI report, you can develop robust business solutions and automate processes such as updating data, sending data driven alerts , requesting approvals, and more. In this blog, we will walk you through how to integrate Power Automate workflows with PowerBI.
How to Optimize PowerBI and Snowflake for Advanced Analytics Spencer Baucke May 25, 2023 The world of businessintelligence and data modernization has never been more competitive than it is today. Table of Contents Why Discuss Snowflake & PowerBI?
One of the great things about PowerBI is all of the native connectors that exist, making it extremely easy for developers to seamlessly connect to the source system and pull their data into PowerBI. In this blog, we’ll discuss why you need a Snowflake connection if you’re using a gateway and how to set one up.
Summary : Microsoft Fabric is an end-to-end Data Analytics platform designed for integration, processing, and advanced insights, while PowerBI excels in creating interactive visualisations and reports. The objective is to guide businesses, Data Analysts, and decision-makers in choosing the right tool for their needs.
There is a massive infiltration of technologies like businessintelligence. The end objective is to make an informed business decision. In this blog, we will unfold the benefits of PowerBI and key PowerBI features , along with other details. What is PowerBI? billion by 2028.
Summary: In PowerBI, slicers and filters serve distinct purposes. Introduction In today’s data-driven world, businesses rely heavily on analytics to make informed decisions. Introduction In today’s data-driven world, businesses rely heavily on analytics to make informed decisions. What are Slicers in PowerBI?
Summary: Counting rows is a fundamental task in PowerBI that requires careful consideration. This blog explores how to get total number of rows in power query. Understanding PowerBI and Its Importance PowerBI is a suite of business analytics tools that allows users to analyze data and share insights.
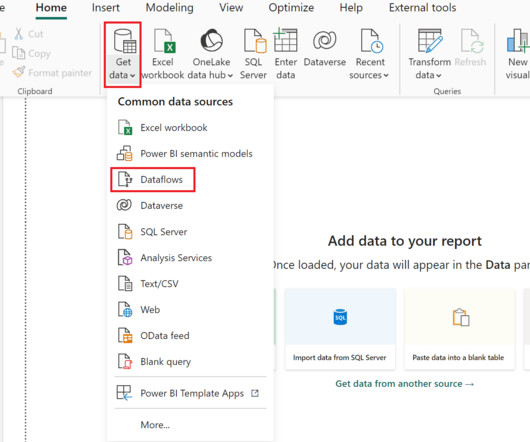
We at phData have written extensively about creating centralized data products in PowerBI. In this blog, we will explain dataflows and their use cases and show an example of how to bring data from Snowflake AI Data Cloud into a dataflow. What are Dataflows, and Why are They So Great?
PowerBI Heatmap: Heatmap in PowerBI refers to the type of custom visualisation that businesses analysts utilise for showcasing the relationship between two variables on a map in different colour patches. It helps the user in visualising the patterns which are hidden and observe the changes across each axis.
Among these tools, KNIME and PowerBI have emerged as key players, catering to the demands of this evolving landscape. Microsoft PowerBI has established itself as a premier data visualization product used to turn unrelated data sources into coherent, visually immersive, and interactive insights.
Summary: BusinessIntelligence tools are software applications that help organizations collect, process, analyse, and visualize data from various sources. These tools transform raw data into actionable insights, enabling businesses to make informed decisions, improve operational efficiency, and adapt to market trends effectively.
At this point, PowerBI has extended itself beyond the definition of just a data visualization tool and truly is a robust businessintelligence platform. One of the more powerful elements of PowerBI is the ability to distribute reporting to end users for self-service analytics through a PowerBI Workspace App.
In addition to BusinessIntelligence (BI), Process Mining is no longer a new phenomenon, but almost all larger companies are conducting this data-driven process analysis in their organization. The measured timestamps (and duration times in case of Task Mining) are enhanced with a time-dimension for BI applications.
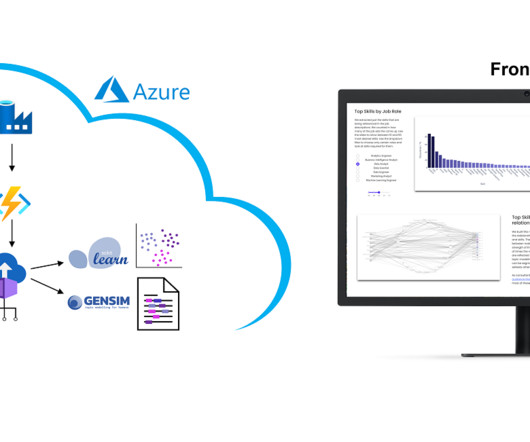
Businessintelligence (BI) users often struggle to access the high-quality, relevant data necessary to inform strategic decision making. The consumer can create a “Python script” connection in Microsoft PowerBI and start creating BI reports for further BI analysis on data products.
Summary: BusinessIntelligence Analysts transform raw data into actionable insights. Key skills include SQL, data visualization, and business acumen. This blog will comprehensively explore the world of BI, dissecting what it is, the multifaceted responsibilities of a BI Analyst, and how to embark on this rewarding career path.
However, we collect these over time and will make trends secure, for example how the demand for Python, SQL or specific tools such as dbt or PowerBI changes. For DATANOMIQ this is a show-case of the coming Data as a Service ( DaaS ) Business. The presentation is currently limited to the current situation on the labor market.
Summary: Understanding BusinessIntelligence Architecture is essential for organizations seeking to harness data effectively. By implementing a robust BI architecture, businesses can make informed decisions, optimize operations, and gain a competitive edge in their industries. What is BusinessIntelligence Architecture?
PowerBI is a versatile and scalable platform that combines self-service and enterprise businessintelligence (BI) capabilities. Data Analysis Expressions (DAX) is the formula expression language employed in PowerBI. In this blog, I will present an in-depth exploration of the SWITCH function in DAX.
PowerBI Datamarts is one of the most exciting features that Microsoft has released for the Power Platform in recent years. If you need high-level information on what a PowerBI Datamart is and some example use cases, check out our other blog, What Are PowerBI Datamarts?
To get participants started, we published a blog post outlining some commonly used open Earth observation datasets. QGIS, Microsoft's PowerBI, Tableau, and Jupyter notebooks also facilitated many interesting visualizations, particularly for solvers with less programming experience. He holds a B.S.
Google Trends – Big Data (blue), Data Science (red), BusinessIntelligence (yellow) und Process Mining (green). Oktober 2014 ↑ The post Big Data – Das Versprechen wurde eingelöst appeared first on Data Science Blog. Quelle: [link] Small Data wurde zum Fokus für die deutsche Industrie, denn “Big Data is messy!”
Diese Anwendungsfälle sind jedoch analytisch recht trivial und bereits mit einfacher BI (BusinessIntelligence) oder dedizierten Analysen ganz ohne Process Mining bereits viel schneller aufzuspüren. Oft bieten bereits ERP-Systeme eine eigene Erkennung hierfür an, die sich mit einfach gestrikter BI leicht erweitern lässt.
Dabei arbeiten wir technologie-offen und mit nahezu allen Tools – Und oft in enger Verbindung mit Initiativen der BusinessIntelligence und Data Science. Process Mining wurde kürzlich in die Power Automate Plattform und in PowerBI integriert. appeared first on Data Science Blog. Ein Praxisbericht.
Businessintelligence has a long history. How will moving to true self-service businessintelligence — and achieving data democracy — impact your organization? A Short History of BusinessIntelligence. Modern businessintelligence starts at the dawn of digital computing. Parting Words.
Summary: Conditional formatting in PowerBI transforms data visualisation by dynamically adjusting visual elements based on data values. Introduction Microsoft PowerBI has a 15.62% market share in data visualisation, making it a leading tool for transforming data into actionable insights. billion in 2023 to USD 63.76
Whether you’re a seasoned tech professional looking to switch lanes, a fresh graduate planning your career trajectory, or simply someone with a keen interest in the field, this blog post will walk you through the exciting journey towards becoming a data scientist. It’s time to turn your question into a quest.
What is BusinessIntelligence? BusinessIntelligence (BI) refers to the technology, techniques, and practises that are used to gather, evaluate, and present information about an organisation in order to assist decision-making and generate effective administrative action. What Does a BI Developer Do?
This blog explores top certifications, factors to consider when choosing one, and future trends, helping aspiring and experienced analysts navigate their professional growth effectively. They use data visualisation tools like Tableau and PowerBI to create compelling reports.
Business users will also perform data analytics within businessintelligence (BI) platforms for insight into current market conditions or probable decision-making outcomes. Together, watsonx offers organizations the ability to: Train, tune and deploy AI across your business with watsonx.ai
IBM® Cognos® Analytics has long been recognized as the gold standard in businessintelligence (BI). But what many might not know is how Cognos Analytics has seamlessly integrated artificial intelligence (AI) to revolutionize users’ BI experience. IBM’s vision for BI 3.0,
They bridge the gap between data insights and actionable strategies, ensuring businesses stay competitive. This blog explores this dynamic role’s updated responsibilities, required skills, and growth opportunities. Expertise in tools like PowerBI, SQL, and Python is crucial.
Summary: This blog delves into hierarchies in dimensional modelling, highlighting their significance in data organisation and analysis. Introduction Dimensional modelling is a design approach used in data warehousing and businessintelligence that structures data into a format that is intuitive and efficient for querying and reporting.
Let’s read the blog to find out! Tableau is a powerful data visualization and businessintelligence tool that can be effectively used by professionals in the field of data science. Accordingly, Tableau Data Scientist salary is generally more than those experts having specialisation in PowerBI.
This blog explores their responsibilities, challenges, and career advancement opportunities in detail. Introduction In today’s fast-paced business environment, organisations are continually seeking ways to improve their operations and increase efficiency. Trello, Asana), and businessintelligence platforms (e.g.,
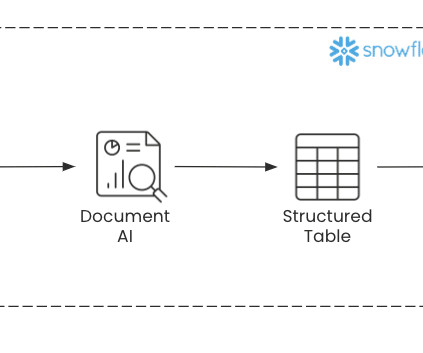
With Document AI from the Snowflake Data Cloud , organizations can utilize the power of LLMs to automate the process of converting unstructured documents into organized tables with ease! In this blog, we’ll cover what the Document AI tool is, what use cases it solves, and how to integrate it with document processing pipelines.
Summary: This blog discusses best practices for designing effective fact tables in dimensional models. This blog will delve into best practices for identifying, designing, and leveraging business metrics in dimensional models, drawing from real-world examples and highlighting the tools and technologies that support this process.
Businessintelligence (BI) platforms. BusinessIntelligence Tools: Businessintelligence (BI) tools are used to visualize your data. Examples of BI tools include Looker, PowerBI , and Tableau. 4) Start visualizing data using businessintelligence tools.
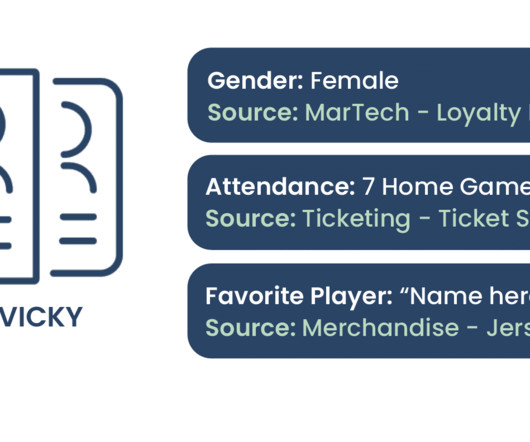
This blog was written by Sara Price and edited by Sunny Yan. In this blog, we’ll demonstrate how to utilize data to drive successful targeted and personalized campaigns for your fanbase to increase revenue, boost operational efficiency, and improve cross-departmental collaboration—all while providing an enriched fan experience.
AWS Prototyping successfully delivered a scalable prototype, which solved CBRE’s business problem with a high accuracy rate (over 95%) and supported reuse of embeddings for similar NLQs, and an API gateway for integration into CBRE’s dashboards.
As businesses increasingly rely on data-driven decision-making, embracing Pricing Analytics can provide a significant edge. This blog delves into the fundamentals of Pricing Analytics, its impact on revenue, and the tools and techniques that can help businesses leverage this powerful resource.
This comprehensive blog outlines vital aspects of Data Analyst interviews, offering insights into technical, behavioural, and industry-specific questions. It is essential to provide a unified data view and enable businessintelligence and analytics. Explain the Extract, Transform, Load (ETL) process.
We organize all of the trending information in your field so you don't have to. Join 17,000+ users and stay up to date on the latest articles your peers are reading.
You know about us, now we want to get to know you!
Let's personalize your content
Let's get even more personalized
We recognize your account from another site in our network, please click 'Send Email' below to continue with verifying your account and setting a password.


Let's personalize your content