This site uses cookies to improve your experience. To help us insure we adhere to various privacy regulations, please select your country/region of residence. If you do not select a country, we will assume you are from the United States. Select your Cookie Settings or view our Privacy Policy and Terms of Use.
Cookie Settings
Cookies and similar technologies are used on this website for proper function of the website, for tracking performance analytics and for marketing purposes. We and some of our third-party providers may use cookie data for various purposes. Please review the cookie settings below and choose your preference.
Used for the proper function of the website
Used for monitoring website traffic and interactions
Cookie Settings
Cookies and similar technologies are used on this website for proper function of the website, for tracking performance analytics and for marketing purposes. We and some of our third-party providers may use cookie data for various purposes. Please review the cookie settings below and choose your preference.
Strictly Necessary: Used for the proper function of the website
Performance/Analytics: Used for monitoring website traffic and interactions
Technical Fellow, Tableau. Tableau has been helping people and organizations to see and understand data for almost two decades, bringing exciting innovations to the landscape of businessintelligence with every product release. Navigating the History of Tableau Innovation viz. Jock Mackinlay. Bronwen Boyd.
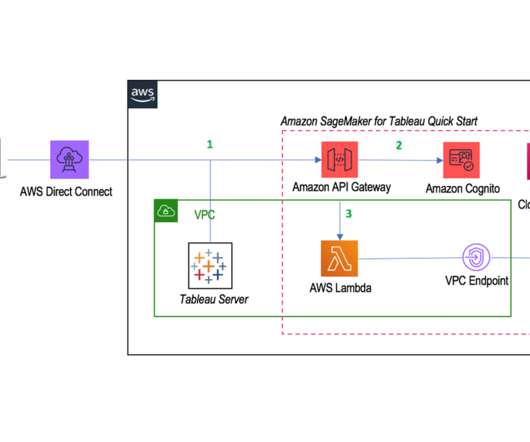
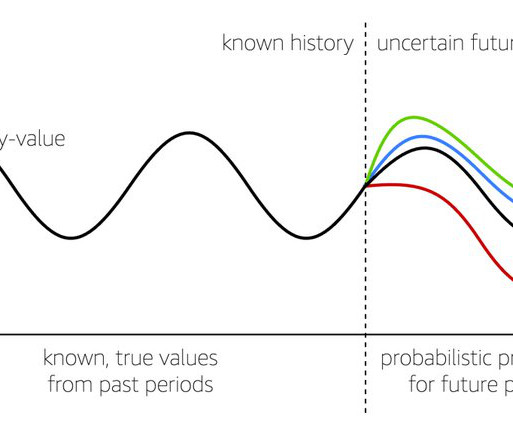
Product Manager, Tableau . The ability to forecast demand and predict behavior can drive business growth, reduce churn and attrition, and optimize processes and supply chains. . We want to help our Tableau and AWS customers democratize data science so that more people can benefit from the power of AI-driven analytics.
Companies use BusinessIntelligence (BI), Data Science , and Process Mining to leverage data for better decision-making, improve operational efficiency, and gain a competitive edge. Data Mesh on Azure Cloud with Databricks and Delta Lake for Applications of BusinessIntelligence, Data Science and Process Mining.
Social Media and Blog Specialist, Tableau. Tableau Ambassadors teach and share while fostering a positive and supportive space within the data community. Tableau Ambassadors serve one-year terms in one of seven branches: Forums, User Groups, Student, DataDev, Public, Social, and CRM Analytics. Bronwen Boyd. Britt Staniar.
Guest author, Tableau DataDev Ambassador. Tableau is an innovator in the field of data visualization with its ease of use, stunning visualizations, vibrant community, and more contributing to success. Tableau recognizes that the way we use data today and the field of analytics is much different now than even a decade ago.
Guest author, Tableau DataDev Ambassador. Tableau is an innovator in the field of data visualization with its ease of use, stunning visualizations, vibrant community, and more contributing to success. Tableau recognizes that the way we use data today and the field of analytics is much different now than even a decade ago.
Technical Fellow, Tableau. Tableau has been helping people and organizations to see and understand data for almost two decades, bringing exciting innovations to the landscape of businessintelligence with every product release. Navigating the History of Tableau Innovation viz. Jock Mackinlay. Bronwen Boyd.
Summary: BusinessIntelligence tools are software applications that help organizations collect, process, analyse, and visualize data from various sources. These tools transform raw data into actionable insights, enabling businesses to make informed decisions, improve operational efficiency, and adapt to market trends effectively.
Summary: BusinessIntelligence Analysts transform raw data into actionable insights. Key skills include SQL, data visualization, and business acumen. This blog will comprehensively explore the world of BI, dissecting what it is, the multifaceted responsibilities of a BI Analyst, and how to embark on this rewarding career path.
In addition to BusinessIntelligence (BI), Process Mining is no longer a new phenomenon, but almost all larger companies are conducting this data-driven process analysis in their organization. For analysis the way of BusinessIntelligence this normalized data model can already be used.
Summary: Understanding BusinessIntelligence Architecture is essential for organizations seeking to harness data effectively. By implementing a robust BI architecture, businesses can make informed decisions, optimize operations, and gain a competitive edge in their industries. What is BusinessIntelligence Architecture?
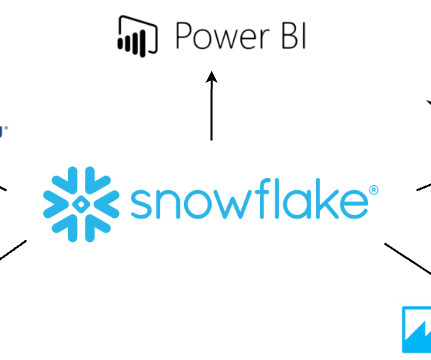
Businessintelligence (BI) has become the cornerstone of decision making for businesses, leading organizations to constantly seek innovative solutions to harness the power of their data. Snowflake Data Cloud, a cloud-native data platform, has emerged as a leading choice for businessintelligence (BI) initiatives.
Senior Director, Product Management, Tableau. Tableau partner Snowflake surveyed business and technology leaders to learn what it means to win in the data economy , what characterizes leaders and laggards, and how it’s important to care about data to achieve successful outcomes. Tableau’s journey to the cloud.
Senior Director, Product Management, Tableau. Tableau partner Snowflake surveyed business and technology leaders to learn what it means to win in the data economy , what characterizes leaders and laggards, and how it’s important to care about data to achieve successful outcomes. Tableau’s journey to the cloud.
Product Manager, Tableau . The ability to forecast demand and predict behavior can drive business growth, reduce churn and attrition, and optimize processes and supply chains. . We want to help our Tableau and AWS customers democratize data science so that more people can benefit from the power of AI-driven analytics.
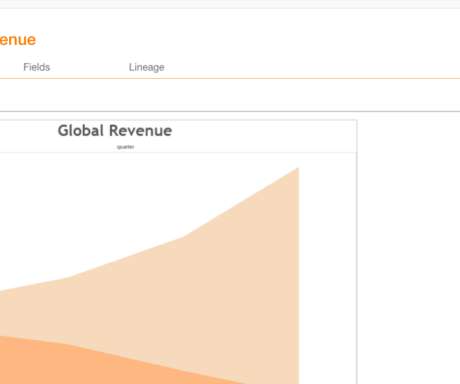
This post originally appeared on www.tableau.com/about/blog. The e-commerce giant leverages Tableau and the Alation Data Catalog to create a seamless process of data discovery and analysis with the goal of enabling all of its 7,500+ employees with self-service analytics. Business users needed greater agility to drive the business.
Social Media and Blog Specialist, Tableau. Tableau Ambassadors teach and share while fostering a positive and supportive space within the data community. Tableau Ambassadors serve one-year terms in one of seven branches: Forums, User Groups, Student, DataDev, Public, Social, and CRM Analytics. Bronwen Boyd. Britt Staniar.
Social Media and Blog Specialist, Tableau. Tableau Ambassadors teach and share while fostering a positive and supportive space within the data community. Tableau Ambassadors serve one-year terms in one of seven branches: Forums, User Groups, Student, DataDev, Public, Social, and CRM Analytics. Bronwen Boyd. Britt Staniar.
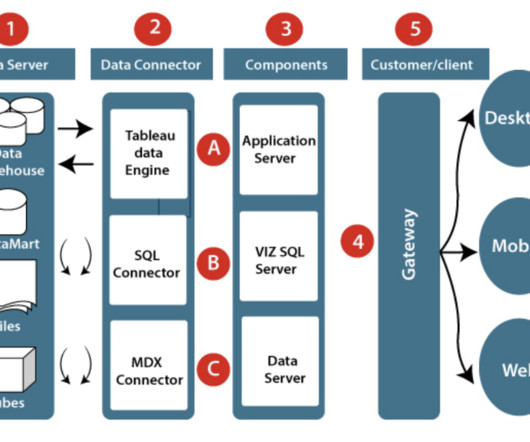
In this world of data-driven, have you ever wondered where this data is stored in Tableau ? Before understanding this data storage, let us know a bit about Tableau. Tableau is one of the most popular data visualization and businessintelligence tools that help people see and understand their data. tde) extensions.
In this world of data-driven, have you ever wondered where this data is stored in Tableau ? Before understanding this data storage, let us know a bit about Tableau. Tableau is one of the most popular data visualization and businessintelligence tools that help people see and understand their data. tde) extensions.
Tableau is a data visualisation software helping you to generate graphics-rich reporting and analysing enormous volumes of data. With the help of Tableau, organisations have been able to mine and gather actionable insights from granular sources of data. But What is Tableau for Data Science and what are its advantages and disadvantages?
Summary: A donut chart in Tableau enhances data visualisation by providing a clear, clutter-free representation of proportions. This guide explains building and customising a donut chart, ensuring better readability and impactful storytelling in business dashboards. One such visualisation is the donut chart in Tableau.
This post originally appeared on www.tableau.com/about/blog. The e-commerce giant leverages Tableau and the Alation Data Catalog to create a seamless process of data discovery and analysis with the goal of enabling all […]. million sellers and 267 million users.
Senior Director, Product Management, Tableau. Tableau partner Snowflake surveyed business and technology leaders to learn what it means to win in the data economy , what characterizes leaders and laggards, and how it’s important to care about data to achieve successful outcomes. Tableau’s journey to the cloud.
Businessintelligence has a long history. How will moving to true self-service businessintelligence — and achieving data democracy — impact your organization? A Short History of BusinessIntelligence. Modern businessintelligence starts at the dawn of digital computing. Parting Words.
Introduction Data visualization is no longer just a niche skill; it’s a fundamental component of Data Analysis , businessintelligence, and data science. This blog post breaks down top data visualization interview questions into two categories: Beginner and Advanced.
This blog explores top certifications, factors to consider when choosing one, and future trends, helping aspiring and experienced analysts navigate their professional growth effectively. They use data visualisation tools like Tableau and Power BI to create compelling reports. Diverse Tools: Covers Excel, SQL, Tableau, and Python.
Whether you’re a seasoned tech professional looking to switch lanes, a fresh graduate planning your career trajectory, or simply someone with a keen interest in the field, this blog post will walk you through the exciting journey towards becoming a data scientist. It’s time to turn your question into a quest.
Integration Retail and (CPG) organizations often rely on applications such as inventory lifecycle management, order management systems, and businessintelligence (BI) dashboards, which incorporate forecasting capabilities. To streamline the visualization, SageMaker Canvas provides embedded visualization for exploring forecast results.
To get participants started, we published a blog post outlining some commonly used open Earth observation datasets. QGIS, Microsoft's Power BI, Tableau, and Jupyter notebooks also facilitated many interesting visualizations, particularly for solvers with less programming experience. Rowan is a BusinessIntelligence Analyst at HunaTek.
A “catalog-first” approach to businessintelligence enables both empowerment and accuracy; and Alation has long enabled this combination over Tableau. Alation’s deep integration with tools like MicroStrategy and Tableau provides visibility into the complete data pipeline: from storage through visualization.
TrustCheck also integrates with third-party businessintelligence tools through our native APIs and is immediately available in Alation V R1 with Tableau Server and Salesforce Einstein analytics. That leads to the question, “How do I know which Tableau data sources to trust?” Subscribe to Alation's Blog.
With blogs, anyone can now write and distribute an article and with message boards anyone can post an advertisement. BusinessIntelligence used to require months of effort from BI and ETL teams. Today, you have Tableau, empowering any analyst to create a report. Subscribe to Alation's Blog.
What is BusinessIntelligence? BusinessIntelligence (BI) refers to the technology, techniques, and practises that are used to gather, evaluate, and present information about an organisation in order to assist decision-making and generate effective administrative action. billion in 2015 and reached around $26.50
A broader definition of BusinessIntelligence. In their Wisdom of Crowds® Data Catalog Market Study, Dresner assessed data catalog solutions from the perspective of businessintelligence (BI). Howard Dresner coined the term “BusinessIntelligence” in 1989. Subscribe to Alation's Blog.
After a momentous year of industry consolidation and unstoppable big tech world domination, controversial placements and omissions linger on in Gartner’s Magic Quadrant for Analytics and BusinessIntelligence Platforms 2020. Read More.
Business users will also perform data analytics within businessintelligence (BI) platforms for insight into current market conditions or probable decision-making outcomes. js and Tableau Data science, data analytics and IBM Practicing data science isn’t without its challenges.
By making that decision, the company hoped it would help businesses keep data safe even if they didn’t have the privacy-boosting resources that a mega enterprise might have. When Google talked about releasing this tool in its blog, the brand pointed out that if you don’t protect user data, you risk losing people’s trust.
Ron Powell, independent analyst and industry expert for the BeyeNETWORK and executive producer of The World Transformed FastForward Series, interviews Adrian Quilis, Director of BusinessIntelligence at MercadoLibre. For that, we are using tools like Alation, Tableau and MicroStrategy. Subscribe to Alation's Blog.
How to Optimize Power BI and Snowflake for Advanced Analytics Spencer Baucke May 25, 2023 The world of businessintelligence and data modernization has never been more competitive than it is today. Microsoft Power BI has been the leader in the analytics and businessintelligence platforms category for several years running.
In a previous blog post I wrote about the concept of data accessibility: how an ever-growing number of successful organizations are increasingly using data to help make more intelligentbusiness decisions. Accessibility is one part of the “Intelligence Elevated” equation. This blog focuses on how that access is achieved.
Businessintelligence (BI) platforms. Later, BI tools such as Chartio, Looker, and Tableau arrived on the data scene. Data analysts have access to the data warehouse using BI tools like Tableau; data scientists have access to data science tools, such as Dataiku. Examples of BI tools include Looker, Power BI , and Tableau.
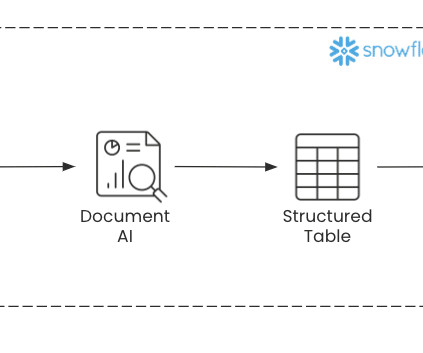
In this blog, we’ll cover what the Document AI tool is, what use cases it solves, and how to integrate it with document processing pipelines. Enhances BI Tools BusinessIntelligence tools are one of the most popular ways to get more actionable insights out of your data. Image taken from Snowflake’s blog.
Summary : This blog provides a comprehensive overview of statistical tools for data-driven research. This blog will explore the fundamental aspects of statistical tools, their core techniques, software options, best practices, case studies, future trends, and address frequently asked questions.
We organize all of the trending information in your field so you don't have to. Join 17,000+ users and stay up to date on the latest articles your peers are reading.
You know about us, now we want to get to know you!
Let's personalize your content
Let's get even more personalized
We recognize your account from another site in our network, please click 'Send Email' below to continue with verifying your account and setting a password.


Let's personalize your content